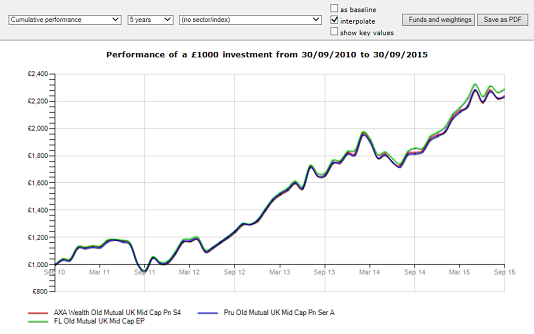
The cumulative graph shows the performance of a £1,000 lump sum investment over the chosen time period. (If you want to graph a value other than £1,000, use the portfolio value graph instead.)
You can change the time period, and choose to include an index on the graph. The sector average is also available for inclusion provided that all the funds (if there is more than one being graphed) are in the same ABI/IMA sector.
The “as baseline” option lets you plot the performance of the fund relative to the chosen index, showing by how much the fund has under- or outperformed the index.
Note:- Portfolios can also be plotted as an index to a fund (or funds) by using it as a custom baseline.

