The stochastic projection graphs use a fund’s historic returns to estimate the probability of future returns. Synaptic Research runs 10,000 Monte Carlo projections per fund and then shows every fifth percentile return between the 5th and 95th percentiles. The median estimated return is highlighted using a diamond shape. 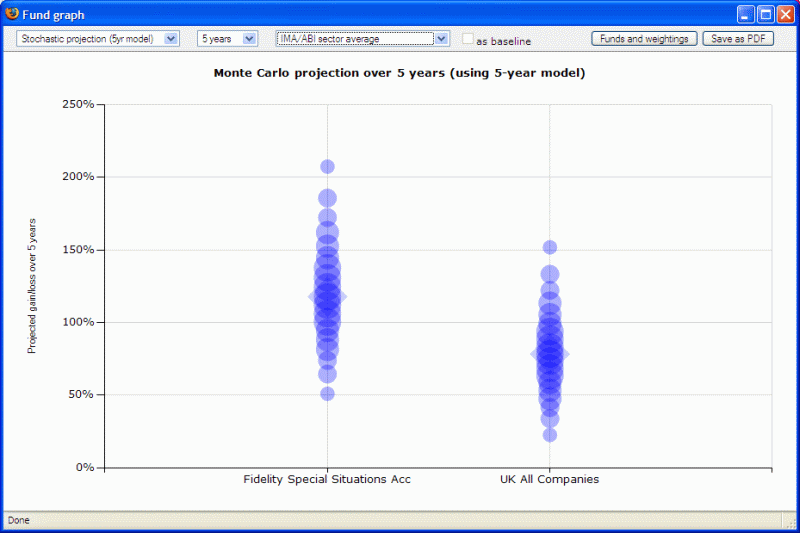 In the first example screenshot above, Synaptic Research is estimating the median of the fund’s projected returns over 5 years to be a gain of about 120% - there is a 50% chance that returns will exceed this, and equally a 50% chance that returns will fall below this level. The 5th percentile is a gain of 50% - i.e. Synaptic Research is estimating a probability of 5% that the fund will gain less than 50% over 5 years (and therefore that the probability of the fund losing money is very low indeed). The graph has also been configured to show the same projection for the sector average: a tighter spread of projected returns; a much lower median return; and more chance of losing money. |
The Monte Carlo projections use actual historic returns over either the last 5 or 10 years, depending on which version of the graph that you use. (Funds cannot be graphed unless they have at least 5/10 years of returns.) The 10-year model will often produce different estimates than the 5-year model. The second example graph below is looking at the same funds and time period as the above example, but is producing lower estimates. 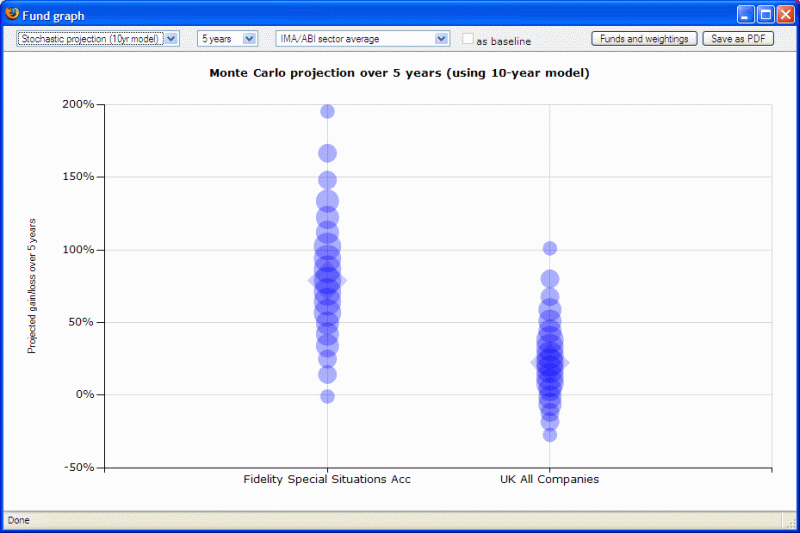 This is because the returns on funds during the period 5 to 10 years ago will be different to the returns during the most recent 5 years. Where the most recent 5 years have seen better performance than years 6-10, the 10 year graph will tend to be more pessimistic than projections based on only 5 years of data (and vice-versa).It’s up to users to decide which they consider 5 years or 10 years to be more realistic. As with all such stochastic models, there are various assumptions implicit in the projection: past performance is (in a sense) a guide to future performance; things which haven’t happened in the past won’t happen in future; and all historic returns are independent and do not affect each other (and therefore funds do not exhibit any form whatsoever of mean reversion). |
-
-
-
- Why am I unable to add a fund to a holding?
- Homepage
- Creating a Contact
- Contact Page
- Risk Rate Holding
- Creating an Off-Platform Holding
- Off-Platform Holdings - Underlying Assets
- Off-Platform Holdings - Contributions
- Off-Platform Holdings - Withdrawals
- Off-Platform Holdings - Performance
- Off-Platform Holdings - Settings
- Creating a Platform Holding
- Platform Holdings - Holdings
- Platform Holdings - Underlying Assets
- Platform Holdings - Contributions
- Platform Holdings - Withdrawals
- Platform Holdings - Performance
- Platform Holdings - Settings
- Creating a Generic Holding
- Generic Holdings - Contributions
- Generic Holdings - Withdrawals
- Generic Holdings - Underlying Assets
- Generic Holdings - Cash Accounts
- Generic Holdings - Assets
- Generic Holdings - Performance
- Generic Holdings - Charges
- Generic Funds - Creating a Fund
- Generic Funds - Asset Class
- Generic Funds - Editing a Fund
- Generic Funds - Deleting a Fund
- Fund Validation on a Product
- Off-Platform Holdings - Holding Report
- Platform Holdings - Holding Report
- Creating a Special Deal on a Contact record
- How do I configure the Contacts tab to only view my clients?
-
-
-
- How do I log into Pathways?
- Homepage
- Creating a new Accumulation Attitude to Risk Questionnaire
- Creating an Attitude to Risk Questionnaire on behalf of your client
- Sending an Attitude to Risk Questionnaire to your client to complete
- Setting Attitude to Risk Manually
- Attitude to Risk Questionnaire Report
- Risk Illustrations
- Risk Illustrations - Navigation
- Risk Illustrations - Creating an Illustration
- Risk Illustrations - Investment Details
- Risk Illustrations - Pathway Selection
- Risk Illustrations - Charges & Fees
- Risk Illustrations - Results Screen
- Risk Illustrations - Results + Costs
- Risk Illustrations - Results + Inflation
- Risk Illustrations - Results + Costs & Inflation
- Risk Illustrations - Capacity For Loss
- Risk Illustrations - Suitability
- Risk Illustrations - Compliance Details
- Risk Illustrations - Report Content
- Risk Illustrations - Advanced Options
- Risk Illustrations - Advanced Options - Illustration Settings
- Risk Illustrations - Advanced Options - Alternative Outcomes
- Risk Illustrations - Advanced Options - 'What If' Scenario
- Risk Illustrations - Advanced Options - Sustainable Drawdown
- Risk Illustrations - Advanced Options - Solve Contributions
- Risk Illustrations - Advanced Options - Term Matrix
- Risk Illustrations - Advanced Options - Change Portfolio/Fund
- Risk Illustrations - Report
- Creating a new Decumulation Attitude to Risk Questionnaire
-
- Why do I need to complete a new Attitude to Risk Questionnaire after the update?
- What does Risk Explorer do?
- What browsers are supported?
- How are the Risk Ratings calculated?
- How do I access Risk Explorer if I already use Salesforce?
- Why is the 'Use Client's Default Risk Category' greyed out on the Pathway Selection screen?
- What is the difference between Illustration Settings and a 'What If' scenario?
- Can I use the software on a mobile/tablet?
- How reliable is the data collected for the Risk Ratings?
- Do I have to follow a specific workflow?
- What Training is available on Salesforce?
- What Support is available?
- Can we update the text on the Attitude to Risk Questionnaire when sending to a client?
- Can I view the scoring method for the Attitude to Risk Questionnaire?
- What Attitude to Risk Questionnaires are available?
- How do the Asset Allocations align to the Attitude to Risk Questionnaire?
- Can I send an Attitude to Risk Questionnaire to the client to complete?
- How can I tell when a client has completed an Attitude to Risk Questionnaire?
- Can I duplicate an illustration?
- Can I have multiple illustrations open at one time?
- Will you be able to setup an end goal for a client at beginning of journey?
- Why can't I see withdrawals and contributions in the graph?
- How do I remove the target amount red line from the graph?
- Where do the Compliance notes in the Attitude to Risk Questionnaire pull through to?
- Why is the Portfolio Fact sheet 'view' button greyed out in the Compliance Details tab?
- How do I include inflation in an Illustration?
- When I click on the link to complete an Attitude to Risk Questionnaire, I get an error - why?
- My Synaptic Pathways screen doesn't look right - How can I resolve this?
- Sustainable Drawdown – why is the retirement age 65 and the term 19 years by default?
-
-
-
- Income Analysis - Creating Research
- Income Analysis - Add Goal Details
- Income Analysis - Plans
- Income Analysis - Income Requirements
- Income Analysis - Other Incomes
- Income Analysis - Annuity
- Income Analysis - Results
- Income Analysis - Results - Export Charts
- Income Analysis - Report
- Income Analysis - Advanced Options
- Income Analysis - Advanced Options - Compare
- Income Analysis - Advanced Options - Creating Scenarios
- Income Analysis - Advanced Options - Editing Scenarios
- Income Analysis - Advanced Options - Choosing your selected scenario
- Income Analysis - Phased Drawdown
- Income Analysis - Joint Life - Create Research
- Income Analysis - Joint Life - Add Goal Details
- Income Analysis - Joint Life - Plans
- Income Analysis - Joint Life - Income Requirements
- Income Analysis - Joint Life - Other Incomes
- Income Analysis - Joint Life - Annuity
- Income Analysis - Joint Life - Results
- Income Analysis - Joint Life - Advanced Options
- Income Analysis - Select scenarios to include in the Report
- Income Analysis - Advanced Options - Income Hierarchy
- Income Analysis - Advanced Options - Scenario Editor
-
- Income Analysis Retirement Cashflow - Creating Research
- Income Analysis Retirement Cashflow - Results & Advanced Options
- Income Analysis Retirement Cashflow - Income Requirements, Other Income and Annuity
- Income Analysis Retirement Cashflow - Report and Illustration
- Income Analysis Retirement Cashflow - Overview
- Income Analysis Retirement Cashflow - Plans
-
-
-
-
- Comparison & Ex-Ante - Creating through the homepage
- Comparison & Ex-Ante - Creating in the research tab
- Comparison & Ex-Ante - Creating within a client record
- Comparison & Ex-Ante - Add Investment
- Comparison & Ex-Ante - Editing Investment Details
- Comparison & Ex-Ante - Research Screen
- Comparison & Ex-Ante - Trades
- Comparison & Ex-Ante - Adviser Fees
- Comparison & Ex-Ante - Select Platform/Custom Combination
- Comparison & Ex-Ante - Research Report
- Basis of Illustration - Results
- Basis of Illustration - Stochastic Forecast
- Basis of Illustration - Deterministic Forecast
- Basis of Illustration - Capacity for Loss
- Basis of Illustration - Suitability
- Basis of Illustration - Ex-Ante Statement
- Basis of Illustration - Compliance Details
- Basis of Illustration - Report Content
- Basis of Illustration - Mark Wrapper as Reviewed
- Client Check-in
- Comparison & Ex-Ante Report
- Off-Platform Product Notes - LV= Smoothed Managed Funds Bond
- Comparison & Ex-Ante - Excluded Products
- Comparison & Ex-Ante - Convert to Holding
-
- Central Investment Proposition - Comparison with ex-ante research
- Comparison & Ex-Ante using a CIP - Creating through the homepage
- Comparison & Ex-Ante using a CIP - Creating in the research tab
- Comparison & Ex-Ante using a CIP - Creating research within a client record
- Comparison & Ex-Ante using a CIP - Add Investment
- Comparison & Ex-Ante using a CIP - Editing Investment Details
- Comparison & Ex-Ante using a CIP - Research Screen
- Comparison & Ex-Ante using a CIP - Research Filtering
- Comparison & Ex-Ante using a CIP - Trades
- Comparison & Ex-Ante using a CIP - Adviser Fees
- Comparison & Ex-Ante using a CIP - Select Platform/Custom Combination
- Comparison & Ex-Ante using a CIP - Research Report
- Basis of Illustration - Results - CIP
- Basis of Illustration - Stochastic Forecast - CIP
- Basis of Illustration - Deterministic Forecast - CIP
- Basis of Illustration - Capacity for Loss - CIP
- Basis of Illustration - Suitability - CIP
- Basis of Illustration - Ex-Ante Statement - CIP
- Basis of Illustration - Compliance Details - CIP
- Basis of Illustration - Report Content - CIP
- Basis of Illustration - Mark Wrapper as Reviewed - CIP
- Client Check-in - CIP
- Comparison & Ex-Ante Report
-
- Ex-Ante - Creating through the homepage
- Ex-Ante - Creating in the Research tab
- Ex-Ante - Creating research within a client record
- Ex-Ante - Add Investment
- Ex-Ante - Editing Investment Details
- Ex-Ante - Research Screen
- Ex-Ante - Research Filtering
- Ex-Ante - Switches/Trades
- Ex-Ante - Adviser Fees
- Ex-Ante - Select Platform
- Ex-Ante - Basis of Illustration - Results
- Ex-Ante - Basis of Illustration - Stochastic Forecast
- Ex-Ante - Basis of Illustration - Deterministic Forecast
- Ex-Ante - Basis of Illustration - Capacity for Loss
- Ex-Ante - Basis of Illustration - Suitability
- Ex-Ante - Basis of Illustration - Ex-Ante Statement
- Ex-Ante - Basis of Illustration - Compliance Details
- Ex-Ante - Basis of Illustration - Report Content
- Ex-Ante - Basis of Illustration - Mark Wrapper as Reviewed
- Ex-Ante - Client Check-in
- Ex-Ante Report
-
- Switching - Creating through the homepage
- Switching - Creating in the research tab
- Switching - Creating within a client record
- Switching - Research Screen
- Switching - Add Ceding Scheme
- Switching - Creating a Ceding Scheme from a Holding
- Switching - Add Target Scheme
- Switching - Results Screen
- Switching - Switches/Trades
- Switching - Fees
- Switching - Family Assets Under Management
- Switching - Comparison Report
- Switching - Report
- Off-Platform Product Notes - LV= Smoothed Managed Funds Bond
- Why is the RIY different for the target scheme of the consolidated schemes compared to the individual schemes target RIYs?
- Switching - Excluded Products
-
-
- 'Something has gone wrong' error in Research
- Why does the RIY increase with a greater % in cash?
- PruFund Growth & Cautious on M&G Wealth
- Why is RIY different when I enter investment amount and AUM separately, compared to adding both amounts as the investment?
- Why does the Ongoing Charge data differ to other sources?
- Why is research not appearing in the navigation bar?
- How do I set a Central Investment Proposition to active?
- I have created a Central Investment Proposition, but I cannot see it's reflected in the research?
- How is Stakeholder pension reflected in the research?
- Why can't I see a specific platform/provider in the research screen?
- Research without a Central Investment Proposition - what does it look like?
- What's the difference between Research with a Central Investment Proposition and without?
- What browsers are supported?
- Can I use the software on a mobile/tablet?
- What Support is available?
- What Training is available on Salesforce?
- My Synaptic Pathways screen doesn't look right - How can I resolve this?
- Pathways Illustration charge vs Provider published charge
- Why is there a negative transaction cost?
- How do I configure the Research tab to only show my Research?
- Off-Platform Pension Switch with Assets Under Management
- What does the link symbol next to a fund represent?
- Why does the Transaction Cost Ex-Ante differ to other sources?
-
-
-
- Can research be conducted from a holding that hasn't been converted from Ex-Ante Research?
- Ex-Post Reviews - How to create a review
- Ex-Post Reviews - Review Screen
- Ex-Post Reviews - Optimise
- Ex-Post Reviews - Optimise - Investment Details
- Ex-Post Reviews - Optimise - Contributions & Withdrawals
- Ex-Post Reviews - Optimise - Costs & Charges
- Ex-Post Reviews - Optimise - Optimise Portfolios
- Ex-Post Reviews - Optimise - Assets Under Management
- Ex-Post Reviews - Stochastic Forecast
- Ex-Post Reviews - Deterministic Forecast
- Ex-Post Reviews - Suitability
- Ex-Post Reviews - Costs & Charges
- Ex-Post Reviews - Capacity for Loss
- Ex-Post Reviews - Compliance Details
- Ex-Post Reviews - Report Content
- Ex-Post Reviews - Client Check-In
- Ex-Post Reviews - Report
- Ex-Post Reviews - Mark as Complete
-
-
-
- Why can't I find Royal London Governed Portfolios and GRIPS?
- Portfolio Builder - Creating a Portfolio
- Portfolio Builder - Fund Weighting to Risk Category Resolver
- Portfolio Builder - Compliance Tab
- Portfolio Builder - Portfolio Factsheet
- Portfolio Builder - Importing Funds into a Portfolio
- Portfolio Builder - Importing Portfolios
- Portfolio Builder - Exporting Funds
- In-House Discretionary - Create a Portfolio
- In-House Discretionary - Funds
- In-House Discretionary - Compliance Tab
- In-House Discretionary - Asset Allocation
- In-House Discretionary - Platforms & Products
- In-House Discretionary - Special Deals
- In-House Discretionary - Amending a Special Deal
- In-House Discretionary - Portfolio Factsheet
- In-House Discretionary - Historic Performance
- There are different ticks next to the funds in my portfolio. What's the difference?
- Is Cash included in the portfolio factsheet?
- What is a Bespoke Portfolio?
- Can I duplicate a portfolio?
- Can I delete a portfolio?
- Can I apply a special deal to MPS portfolios?
- How do I configure the Portfolio Builder tab to only show my portfolios?
-
-
-
- Investment Pathways
- Creating a Central Investment Proposition
- Central Investment Proposition - Adding On Platform Products
- Central Investment Proposition - Adding Off Platform Products
- Central Investment Proposition - Adding Portfolios
- Central Investment Proposition - Adding Fund Lists
- Central Investment Proposition - Creating Segments
- Central Investment Proposition - Adding On Platforms to a Segment
- Central Investment Proposition - Adding Off Platforms to a Segment
- Central Investment Proposition - Adding Portfolios to a Segment
- Central Investment Proposition - Adding Fund Lists to a Segment
- Central Investment Proposition - Adding Adviser Fees to a Segment
- Central Investment Proposition - Assigning Users to a Segment
- Investment Pathways - Discretionary Fund Managers, Multi-Asset & Insurance Distribution Directives
- Investment Pathways - Model, Bespoke & In-House Discretionary Portfolios
- Investment Pathways - Risk Ratings
- Adding/Removing Portfolios from the Central Investment Proposition
-
-
- Configuration
-
- Company Settings - Company Information
- Company Settings - Branding
- Company Settings - Terms & Conditions, Disclaimer and Risk Questionnaire Message
- Company Settings - Organisation Growth Rates
- Our company logo is appearing too large on the report - why is this?
- Can we include our regulatory statements on communications and reports?
- Can I upload my own branding?
-
-
- Synaptic Pathways - How to reset a users password
- Setup - Attitude to Risk Questionnaire
- How to reset a users password
- Administrator Password Reset
- Adding New Users
- How to grant access to Support
- User did not receive a password reset email
- I've pinned a task to the navigation bar, how do I unpin it?
- How do I access Synaptic Pathways if I already use Salesforce?
- Password reset – I cannot bypass the security question, how can I gain access?
- Assigning Whole of Market Permissions
- Why is Salesforce mandating Multifactor Authentication (MFA)
- Setting up Multifactor Authentication
- Setting up a new device for Multifactor Authentication
-
-
- Entering your Synaptic Webline Credentials
- Creating a Protection quote
- Selecting Benefits
- Quote Results Screen
- Edit/View Benefit
- Level Term Assurance Quote
- Critical Illness Quote
- Business Protection Quote
- Convertible Term Assurance Quote
- Decreasing Term Quote
- Family Income Benefit Quote
- Income Protection Quote
- Whole of Life Quote
- Joint Life Quote
- Comparison Report
- More Info & Documents
- Apply
-
-
-
- What's in Pathways 6.15 Release?
- What's in Pathways 6.14 Release?
- What's in Pathways 6.13 Release?
- What's in Pathways 6.12 Release?
- What's in Pathways 6.11 Release?
- What's in Pathways 6.10 Release?
- What's in Pathways 6.9 Release?
- What's in Pathways 6.8 Release?
- What's in Pathways 6.7 Release?
- What's in Pathways 6.6 Release?
- What's in Pathways 6.5 Release?
- What's in Pathways 6.4 Release?
- What's in Pathways 6.3 Release?
- What's in Pathways 6.2 Release?
- What's in Pathways 6.1 Release?
- What's in Pathways 6.0 release?
- What's in Pathways 5.1 release?
- What's in Pathways 5.0 release?
- What's in Pathways 4.2 Release?
- What's in Pathways 3.0 Release?
- What's in Risk Explorer 2.0 Release?
- What's in Pathways 7.0 Release?
-
-
-
-
- Email Verification & Password Reset
- Verifying your email address
- Password Reset
- Webline Settings - Agency Codes
- Webline Settings - Commission Settings
- Webline Settings - Adding New Users
- Webline Settings - Provider Panel
- Webline Settings - How to disable users
- Webline Settings - Editing your details
- View Your Details
- Edit Your Details
- View All Users
- Add New User
- Edit Your Account
- Product and Provider Panels
- Agency Codes
- Commission Settings
- User Options - Vendor Administrator Access
- How to edit your Account Details - Vendor Administrator Access
- How do I create more user accounts on Webline?
- Registration
- Change Password
- Settings
- Account Details
- Add a new user in Webline
- Change Company Name/Contact Details
- Change Regulatory Details
- Change Registered Address
- Set or Edit a Business Reply Address
- Compliance Text
- Info
- Documents
- Software Required
-
- Synaptic Webline Protection - Comparison Reports
- Synaptic Webline Protection - Accident, Sickness & Unemployment Cover
- Synaptic Webline Protection - Partially Underwritten Quotes
- Synaptic Webline Protection - Apply Basket
- Synaptic Webline Protection - User Interface Improvements
- Synaptic Webline Protection - Multi Benefit
- Synaptic Webline Protection - Finding Quotes
- Apply Basket - Send to my System
- Apply Basket - Send to my Email
- News Section
- Top Tip - Critical Illness Table
- Top Tip - Quick Commission
- Webline Protection - Introduction
- Logging into Webline through the Synaptic Suite
- Client Details Standalone Products - Requesting Quotes
- Requesting Quotes - Common Buttons
- Requesting Quotes - Standalone Products
- Requesting Quotes - Product Details
- Requesting Quotes - Decreasing Term Assurance
- Requesting Quotes - Family Income Benefit
- Requesting Quotes - Income Protection
- Requesting Quotes - Whole of Life
- Requesting Quotes - Accident, Sickness & Unemployment
- Results
- Results - Whole of Market Option
- Results - Producing an Illustration
- Results - "Refreshing" a Quote Result Screen
- Results - Selecting the Product
- Multi Benefit Products
- Multi Benefit Products - Product Details & Quick Commission
- Multi Benefit Products - Level Term Assurance
- Multi Benefit Products - Decreasing Term Assurance
- Multi Benefit Products - Critical Illness Cover
- Multi Benefit Products - Income Protection
- Multi Benefit Products - Family Income Protection
- Multi Benefit Products - Waiver of Premium
- Results - Multi Benefit
- Grouped Results View
- View Options
- Applying
- Evidence of Research
- Finding Quotes
- Provider Documents
- Help
- Settings
- Logging out of Webline
- Leave Feedback
-
- Why am I getting an agency error when generating a quote?
- Can I get instant cover for Accident, Sickness and Unemployment?
- Why have I not received a password reset email?
- How do I disable pop-ups?
- Why is a Provider in the results screen, but not appearing in the Comparison Report?
- I get a warning message ‘no response’ on Webline – why is this?
- Why does quote prices sometimes differ between Webline and providers?
- Why certain providers do not return quotes?
- Why do one (or more) providers not return quotes for me on Webline?
- Can I quote joint life insurance on Webline, which pays out on second death?
- When I click e-apply and buy now on Webline, I don’t get through to the providers website?
- Webline errors - something went wrong?
- Why do I get "Agency number mismatch" on Webline?
- Where can I view the Critical Illness Coverage table?
- Why do I get connectivity errors when trying to access Webline abroad?
- How do I quote Relevant Life policies only?
- How do I update my Webline password in the Synaptic Suite?
-
-
-
-
- Risk Rated Holdings
- Risk Rated Holdings within the Client Module
- Risk Rated Holdings within Modeller
- Synaptic Software Client User Guide
- Synaptic Software Client Administration Guide
- Getting started - Client Module & ATR Questionnaire
- Getting Started - Creating Holdings
- Top Tip - Adding a Portfolio into a Holding
- Improved Client Search
- Application Tabs
- Creating New Clients
- Adding & Removing Users from the Client Module
- Attitude to Risk (ATR)
- Creating Holdings
- Custom Asset Types
- Finding an Existing Client
- Setting Vitality Client Status within Comparator
-
- Why do I need to complete a new Attitude to Risk Questionnaire after the update?
- How do I add funds to a Manual Fund List?
- How do I add Manual Asset Classes?
- How do I add a Self Invested Personal Pension (SIPP)?
- How do I add a Platform?
- How do I create a policy report?
- How do I create an Accumulation Goal?
-
-
- Why do I need to complete a new Attitude to Risk Questionnaire after the update?
- Synaptic Risk Rating User Guide
- A2Risk Adviser Guide
- What is included in the Risk Service?
- Accessing the Risk Service in Synaptic Suite
- Accessing the Attitude to Risk Questionnaire
- Using Synaptic Attitude to Risk Questionnaire
- Top Tip - Attitude to Risk Questionnaire
- Top Tip - Paper Attitude to Risk Questionnaire
- Top Tip - Using your client's Attitude to Risk to select a Portfolio or Fund
- ATEB Suitability content integration
-
-
- Synaptic Modeller User Guide
- What is Synaptic Modeller?
- Risk Rated Holdings within Modeller
- Adding a New Client
- Finding an Existing Client
- Setting the Default Attitude to Risk
- Client Attitude to Risk Report
- Recording Holdings
- Modelling a Goal Based Scenario
- Finding Existing Goals
- Reviewing a Goal
- Scenario Modelling Report
-
- How do I use the work space for modelling new scenarios?
- How do I rebalance portfolios?
- What do the Modeller graphs tell me?
- I have completed the modelling session, but the final report is not loading – why is this?
- I cannot find a specific fund in Modeller – why is this?
- My chosen fund is unavailable – why is this?
- My chosen fund’s asset allocations are missing – why is this?
- I get a warning message when selecting a specific fund – what could be causing this?
- How do I get values for any holdings by using contract enquiry?
- How can I manually add or update values to holdings?
- How do I add a cash ISA to holdings?
- How do I reset my password?
- Is it possible to do joint reports in Modeller?
- How do I delete a duplicate record?
- How is the attitude to risk level determined? What is this based on?
- Where can I find the asset allocation graphs in Modeller?
- How are the asset allocations updated?
- How do the calculations work in Modeller?
- What is the £10k illustration screen?
- What is the capacity for loss figure? How can these be determined?
-
-
- Synaptic Analyser Quick Start Guide
- Synaptic Analyser User Guide
- Logging into Synaptic Analyser
- Routes through the system
- Phased Drawdown
- Phased Drawdown - Adding Plans
- Phased Drawdown - Income Requirements
- Phased Drawdown - Other Income
- Phased Drawdown Results
- Phased Drawdown - Add Annuity
- Phased Drawdown - Overall Results
- Synaptic Analyser - Other Income
- Creating Holdings
- Synaptic Analyser - Product Comparison
- Synaptic Analyser - Income Analysis
- Synaptic Analyser - Completing Income Analysis through the Results Screen
- Costs and Charges Calculator
- Maturity Values Calculator
- Projection Calculator
- Income Analysis Research - Adding Goal Details
- Income Analysis Research - Adding Plans
- Income Analysis Research - Income Requirements
- Income Analysis Research - Other Income
- Income Analysis Research - Add Annuity
- Results Page
- Product Comparison Research
- Filtering Screen
- Product Comparison Results Screen
- Reports
-
- What is Synaptic Analyser?
- Why am I unable to run a Phased Drawdown scenario directly through the Results screen?
- When running through a Phased scenario, why am I only able to make changes to the summary details in the phased drawdown screen and not within the final results?
- Within the Plans area, why is there only one Phased option when I can choose UFPLS or PCLS separately?
- Why is Other Income mandatory when selecting ‘Phased’?
- How do I link my Webline account?
- How is the tax calculated in Analyser?
- I am trying to generate an Annuity quote within Analyser and I am getting an error - why is this?
- How do I select a client when clicking into Analyser?
- How do I add and amend client details?
- Where can I add a holding to use within Analyser?
- How do I add Income Sources?
- Where can I find previous Analyser research?
- How do I start Analyser research?
- Can I override the Forecast Life Expectancy?
- Are you able to upload your own logos for the report?
- Is tax included in the calculations?
- Does the client have to take the full 25% when selecting the PCLS option?
- How do I select a fund/portfolio within Analyser?
- Are the state pension calculations triple locked?
- How do I export the charts?
- Can Analyser demonstrate results in the event of a market crash?
-
-
-
- Synaptic Comparator Setup Quick Start Guide - Download
- Setting up service levels and adviser fees
- Setting up assets, panel and reports
- Introduction to fund panels and portfolio builder
- Setting up contacts
- Introduction to provider special deals
- Introduction to organisation structure
- Synaptic Comparator Administrator User Guide - Download
- Portfolio Management
- Panel Management
- Fund Management
- How to control the branch / sub company panel permissions in Synaptic Comparator
- How to create users in Synaptic Comparator
- Setting up Client & Family Assets Under Administration
- Setting up adviser charges
-
- Synaptic Comparator Quick Start Guide - Download
- Synaptic Comparator User Guide - Download
- Synaptic Comparator - Pension Switching Guide
- Synaptic Comparator Cash Feature User Guide
- Top Tip - Pulling values into the Critical Yield Calculator
- Getting started with cost and charges calculator
- Getting started with projection calculator
- Getting started with maturity value calculator
- Getting started with critical yield calculator
- Generic Fund
- How to conduct research in Synaptic Comparator?
- Creating a new contact in Synaptic Comparator
- Investment details for ISA
- Investment details for Onshore and Offshore bonds
- Investment details for SIPP
- Investment details for a Personal Pension
- Investment details for GIA
- Changing the default report look and feel
- Application Tabs
- Using the Existing Plan area
-
- How to access Synaptic Comparator using Microsoft Edge
- How to access Synaptic Comparator through Google Chrome
- Can’t find a fund?
- I am doing ISA research and have to specify GIA amount – why is this?
- I am doing ISA research and all of the platforms have been knocked out – what could be the reason for this?
- Why are no funds found when trying to create a portfolio?
- How to generate Fund factsheets
- How to view previously completed research / reports
- How to edit a contact in Synaptic Comparator
- How to delete a contact in Synaptic Comparator?
- How to resume unfinished research?
- How to duplicate a contact in Synaptic Comparator?
- How To Reassign A Contact In Synaptic Comparator?
- How To Duplicate Piece Of Research?
- Where can I see the initial adviser fees on a client report?
- I have amended adviser fees in Comparator, but the fees haven’t changed? Why is this?
- How do I set a flat rate of £1000 initial fee for an adviser?
- I have tried logging in and now the site says I am logged out – why is this?
- Can I reassign clients to another user?
- Forgotten password?
- Synaptic Comparator uses Silverlight – what are the plans on developing the product with regards to Silverlight?
- I have a special deal with a provider, how do I add these to Comparator?
- I have completed the research, but the final report is not loading – why is this?
- Where can I find platform factsheets?
- When are ISA rates updated for Comparator?
- I’m researching a specific wrapper to be included in the platform and the results are showing zero platforms available – what could be causing this?
- Why is cash account under investment details greyed out?
- Why do I get an error message when adding cash account feature?
- My report buttons are missing - why is this?
- Comparator Report is showing dollar and pound signs - Why is this?
-
-
- Introducing Webline Play
- Integrating Synaptic Webline Play, Quote & Apply
- Synaptic Webline Play - Integrating Webline Play into your website
- Synaptic Webline Play - How to apply for a quote
- Webline Play - Colour Options
- Webline Settings - Agency Codes
- Webline Settings - Commission Settings
- Webline Settings - Provider Panel
- Webline Settings - Editing your details
- Webline Settings - Adding New Users
- Webline Settings - How to disable users
- Webline Play - Life Insurance Quotes
- Webline Play - Income Protection Quotes
- Webline Play - Integrating Webline Play onto your website
-
-
- Using the same account on multiple computers
- Is there a limit on concurrent users?
- Can I delete users?
- How do I create new users and edit accounts?
- Can I change a users details and password?
- Can I change the administrative password for our account?
- How do I administer my firm's user list?
- How do I add my agency codes?
-
- Synaptic Suite Product User Guide
- Synaptic Suite Fund Guide
- Top Tip - Ethical Fact Find
- How to log into Products on our website
- How to conduct research - ISA scenario
- Fund Factsheets
- Funds from a specific promoter and specific contract
- Quick Find Box - Contract Tab
- Quick Find Box - Company Tab
- Quick Find Box - Fund Tab
- Quick Find Box - Client Tab
- How do I update my Product & Fund research password in the Synaptic Suite?
- How do I navigate the software?
- How do I start a piece of research?
- Overview of the research process
- Choosing a product type
- Entering client details
- What is the layout of the filtering screen?
- Grid of contracts
- Adding columns to the grid of contracts
- Filtering the grid of contracts
- Ranking contracts
- Generating a suitability report
- How do I search for fund factsheets?
- Re-opening old research
- Manually selecting the contracts to research
- Basic hints and tips
- Application Tabs
-
- What is the best way to check if a specific fund is linked to a Contract?
- Why can't I find Royal London Governed Portfolios and GRIPS?
- What are the AIC sector changes for Investment Trusts?
- Where has the IA Money Market sector gone?
- I can't log into Synaptic Product & Fund Research - Why?
- Who supplies the past performance data and how often is it updated?
- What are the different types of fund research?
- Are there any tools available?
- Are there any tips when using fund research?
- Are there any tips when filtering?
- What is the Resource Centre?
- The home page
- Do I use the Fund Picker or research into linked funds?
- How do you use the field chooser?
- How do I obtain protection quotes through Synaptic?
- What fund reports can I produce?
- What is the difference between Quick reports and Suitability reports?
- Can you edit Suitability reports?
- How does Synaptic deal with contract data?
- Does Synaptic save clients and research?
- How do you calculate the Stochastic projection graphs?
- Where do I find products and how do I start new research?
- How do I start fund research?
- What report templates do you have on Synaptic?
- Where can I find Special offers?
- Can I sort the grid in the filtering screen?
- Can I share research?
- Can I send research to other users?
- Can I send research between users?
- How is the sector position graph calculated?
- How do I save results from the fund picker and include it in reports?
- Can I save and export the research grid?
- How is the returns each month graph calculated?
- Can I research new and existing business?
- What is the difference between Report Manager Suitability reports and Quick reports?
- Can I remove all filters on the filtering screen?
- Can I record notes on research?
- How are the ranking graphs calculated?
- How are funds ranked?
- How do I rank contracts into a league table?
- Do you have a link to quote engines?
- What is in the Quick reports and can they be edited?
- How is the quartile ranking graph calculated?
- How are the contracts categorised?
- Is there a difference between Product Research and Fund Research?
- How is Synaptic Research beneficial to Product providers?
- How do I setup Preset Criteria?
- How do I create a Portfolio?
- How is the portfolio value graph calculated?
- Can I produce a Portfolio report?
- How is the portfolio composition graph calculated?
- How is the performance vs. volatility graph calculated?
- Can I create a panel of products?
- Can I create mutual fund analysis and factsheets?
- How do I use Manual fund lists?
- How is the monthly premium graph calculated?
- How can I create market research?
- Can I manually exclude contracts?
- Can I create a list of linked funds for a contract?
- Is there limitations if you only subscribe to one module of Synaptic Research?
- Do you integrate with other software?
- How do I import filtering from old research?
- How are the ranking scores calculated?
- Can I lock features within preset criteria?
- Can I create a portfolio graph?
- Can I give users the ability to create preset criteria?
- Can I generate multiple fund factsheets and graphs?
- What fund sectors do you have on Synaptic Research?
- How do you use the Fund Picker?
- What fund graphs can I find on Synaptic Research?
- What information is in the fund factsheets?
- Do you have Ethical funds on the system?
- Can I flip the grid in the filtering screen?
- How do I find old research?
- How do I find contracts, providers, funds, and clients?
- Who supplies your data?
- What are the benefits of using Synaptic Research?
- How do I filter the grid of contracts?
- How do I filter on statistics within Product research?
- Can I filter on specific linked funds?
- How do I filter on sectors?
- How do I filter on policy conditions?
- How do I filter on past performance?
- How do I filter on field values in the grid?
- How do I filter on features?
- Can I view field definitions and contract notes?
- What data does FE fundinfo supply?
- How is the distribution of returns graph calculated?
- Can I distribute personal presets across the firm?
- Can I display factsheets from the data grid?
- What are the differences between product-focused and client-focused research?
- What are the differences between fund research and product research?
- Can I delete research?
- What are the definitions of fund performance figures?
- How do I define portfolio holdings and settings?
- What products do you have on Synaptic Research?
- How is the cumulative performance graph calculated?
- How do I create shared research for other users to import?
- How do I create preset criteria?
- Can I create new research based on existing research?
- Can I create multiple presets?
- Can I copy research?
- Can I create bespoke Report Manager Suitability report templates?
- What data is within contract factsheets?
- Can you use Synaptic research for Compliance checking?
- How do I create a comparison report?
- How do I create a Company factsheets
- How can I check fund availability?
- How do I change the title of research?
- Can I change the order of data fields in the grid?
- How do I carry out file-checks?
- How do I build grids and filtering contracts?
- What browser software can I use?
- Do you have any browser hints and tips?
- Do I need to configure my browser to use Synaptic Research?
- Is bid-to-bid used for the data on your factsheets?
- How is the best/worst returns graph calculated?
- What are the basics of fund research?
- How is the asset allocation graph calculated?
- How is the annual premium graph calculated?
- How is the annual performance graph calculated?
- How is the alpha vs. beta graph calculated?
- How do I add fields to the grid?
- When do presets take effect?
- How do I set up Personal Preset Criteria?
- Can I share my research?
- How can I filter on Past Performance?
- How do I research Stocks and Shares ISA - Alternative Investment Market?
- What is Ranking?
- How do I use the Fund Picker?
- How do I retrieve research?
- How do I select a Product Area to Research?
- How do I start client focused research?
- How do I start Product Focused Research?
- What are the differences between Client Focused and Product Focused Research?
- Introduction to filtering
- Have you got any tips on filtering?
- How do I filter on features?
- How do I filter on sectors?
- How do I filter on Policy Conditions?
- How do I filter on Specific Linked Funds?
- How do I filter on Statistics?
- Can I remove all filtering within a piece of Research?
- How do I manually exclude contracts?
- Can I create an audit trail?
- How do I filter using a grid of contracts?
- How do I create Multiple Reports on Synaptic Research?
- How do I send research in Synaptic Research?
- Where is my research stored?
- How long is stored research held on the system for?
- Why is no Quote link being displayed for a product type?
- Does Synaptic Research “run in offline mode”?
-
-
-
- Where can I find my Account Settings?
- What can someone in an Adviser role see and do?
- How do I change my password?
- How do I sign out?
- Can I customise Modeller?
- What is the difference between Portfolio/Panel
- How do I add a new portfolio/panel?
- Can I share portfolios?
- Can I import funds by Citicode?
- How do I use the portfolio wizard?
- How do I produce factsheets?
- Where can I find the organisation and users area?
- How do I add additional organisations?
- How do I add new users?
- What can someone in a Paraplanner role see and do?
- What can someone in a Administrator role see and do?
- What can someone in a EMP administrator role see and do?
- What can someone in a EMP User role see and do?
- What can someone in a Corporate User role see and do?
- What can someone in a Modeller Journey Override role see and do?
- How do I find a user?
- How do I delete and edit a user?
- How do I reset a users password?
- How do I setup client service levels?
- How do I add custom asset types?
- What can you do within the fund universe area?
- How do I setup Modeller Journey Override and Fund Based Journey?
-
-
-
- Session 1 - Introduction & Homepage
- Session 2 - User List, File Check & Preset Criteria
- Session 3 - Multiple Report, Resource Centre & Account Details
- Session 4 - ISA Scenario
- Session 5 - Quick Find Box & Recent Tab
- Session 6 - Fund Research by Universe
- Session 7 - Funds linked to a specific contract & Funds from a specific promoter
- Session 8 - Manual Fund List
- Session 9 - Risk Rated Funds
-

