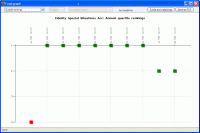
The quartile ranking graph shows a plot of a fund’s quartile rankings within each discrete 12-month period. In the first example screenshot below, the fund has been a top-quartile performer in 7 out of the 10 periods.
A similar plot of the fund’s quartile rankings is included in fund factsheets.
When graphing a single fund the values are shown as point markers for each period, colour-coded red for below-average performance (i.e. quartiles 3 and 4) and green for above-average performance (i.e. quartiles 1 and 2).
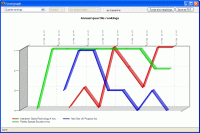
When graphing multiple funds the style changes to a 3D line chart, and each fund is allocated a consistent colour on the graph rather than having each individual point colour-coded according to performance.
The second example screenshot below illustrates a quartile ranking graph for multiple funds.