Fund factsheets show four types of information about a fund:
- Basic details such as management group, sector, and fund size.
- Past performance, including derived functions of past performance such as quartile rankings, alpha
- FE Crown ratings.
- Asset allocation data.
The linked contracts through which the fund can be bought.
The three screenshots below illustrate the sections of a fund factsheet, and are described further below.


N.B. Customers of the basic version of Synaptic Research only have access to much more limited fund information. Please contact Synaptic if you would like to upgrade to the full fund factsheets.
Opening a fund factsheet
The factsheet for a fund can be opened in a number of ways:
- By searching for the fund on the software’s home page.
- By clicking on a fund in the Linked Funds section of a contract factsheet.
- By clicking on a fund in a list of linked funds for a contract, or by ticking the boxes for one or more funds and then using the Show Factsheets button.
Past performance information in fund factsheets
Fund factsheets contain the following past performance information. All figures are on a bid-to-bid basis, and “year” means a 12-month period, not(necessarily) a calendar year.
- Table of cumulative performance (gain/loss) over 10 years to date, for both the fund and its sector average. The figures for the fund are colour-coded green when the fund has beaten the sector average, and red where not.
- FE Crown ratings.
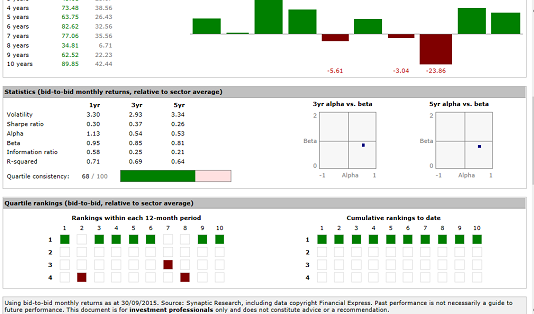
- Bar chart showing the fund’s gain or loss within each of the last ten years.
- Table of risk metrics showing volatility, alpha, beta, and r-squared over 3 and 5 years. Alpha, beta and r-squared are calculated compared to the IMA/ABI sector average.
- Scatter charts plotting the alpha and beta figures over 3 and 5 years.
- Quartile consistency score and bar.
See the section on past performance data for full explanations of how these figures are calculated.
The indicators at the top of fund factsheets
The indicators in the top-right of a fund factsheet (as illustrated by the first screenshot above) show a fund's quartile rankings, its alpha, and its Sharpe ratio over various periods.
The factsheet shows two groups of indicators. The left-hand block shows cumulative values over the last 1, 3, and 5 years. The right-hand block shows the values for the 3 most recent discrete annual periods, and therefore is designed to highlight recent trends rather than long-term performance. (The first column of both blocks is always the same, because both are looking at the most recent 12 months of performance.)
Values are colour-coded: dark green for very good; light green for good; pink for poor; and red for very poor.
Quartile rankings are simply colour-coded according to the quartile:
o Very good: top quartile
o Good: second quartile
o Poor: third quartile
o Very poor: fourth quartile
Alpha is colour-coded as follows:
o Very good: 0.3 or higher
o Good: 0 to 0.3
o Poor: -0.2 to 0
o Very poor: less than -0.2
Sharpe ratios are colour-coded as follows:
o Very good: 0.6 or greater;
o Good: 0.3 to 0.6;
o Poor: 0 to 0.3
o Very poor: less than 0
The list of linked contracts
The list of linked contracts at the bottom of a fund factsheet can be turned off using the tickbox bar at the top of the page (and is not shown at all if you are generating fund factsheets from the list of linked funds for a contract).
Each of the three columns in the list is a hyperlink. The company name is a link to the company factsheet; the contract name is a link to the contract factsheet; and the type of product is a link for starting new research into that product type.

