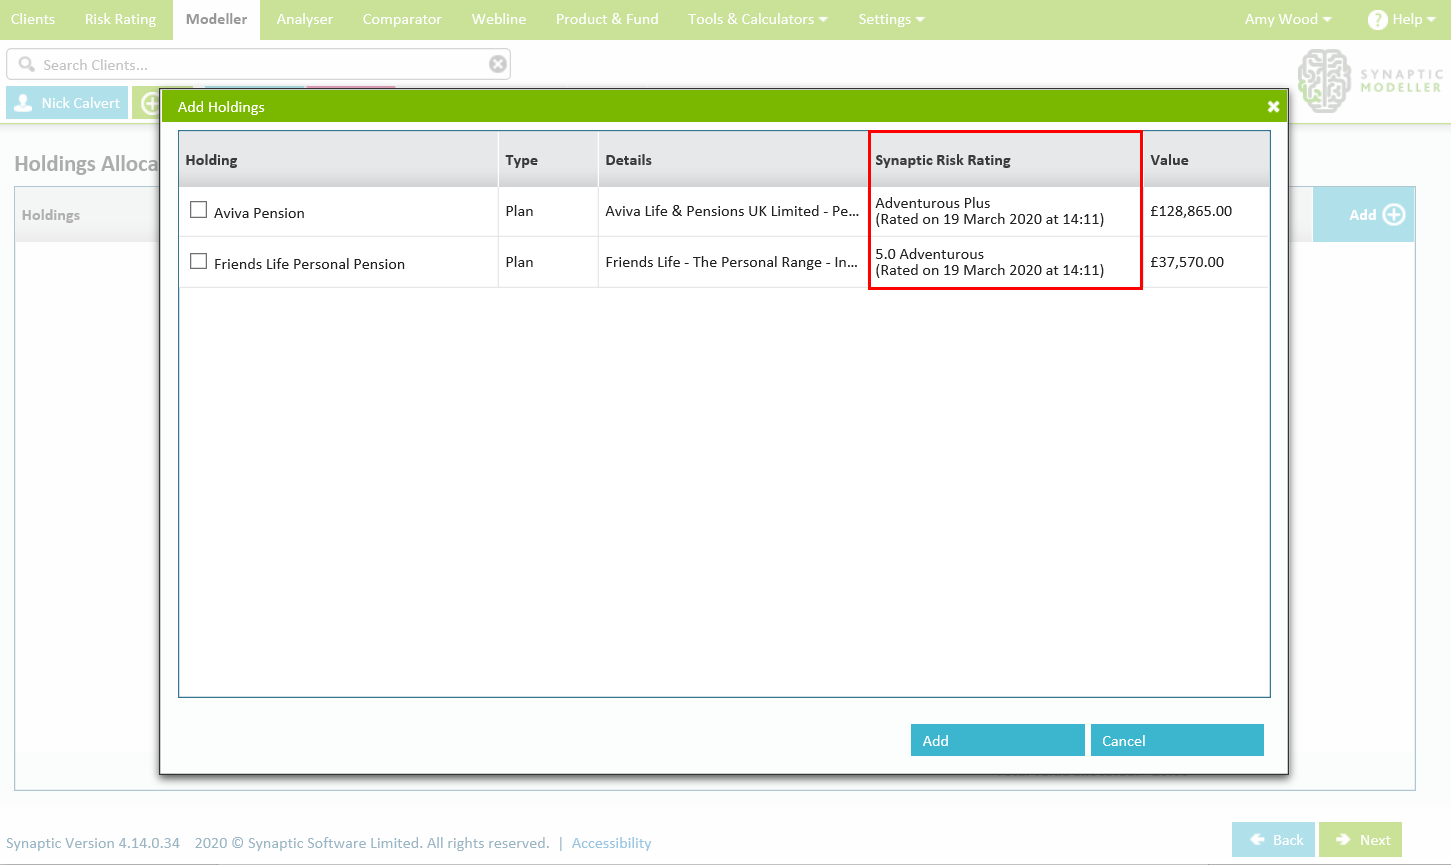
Once your holdings have been risk rated, you are able to view this information within the Modeller journey.
When adding the holdings to the goal, you can see the risk rating against each holding:
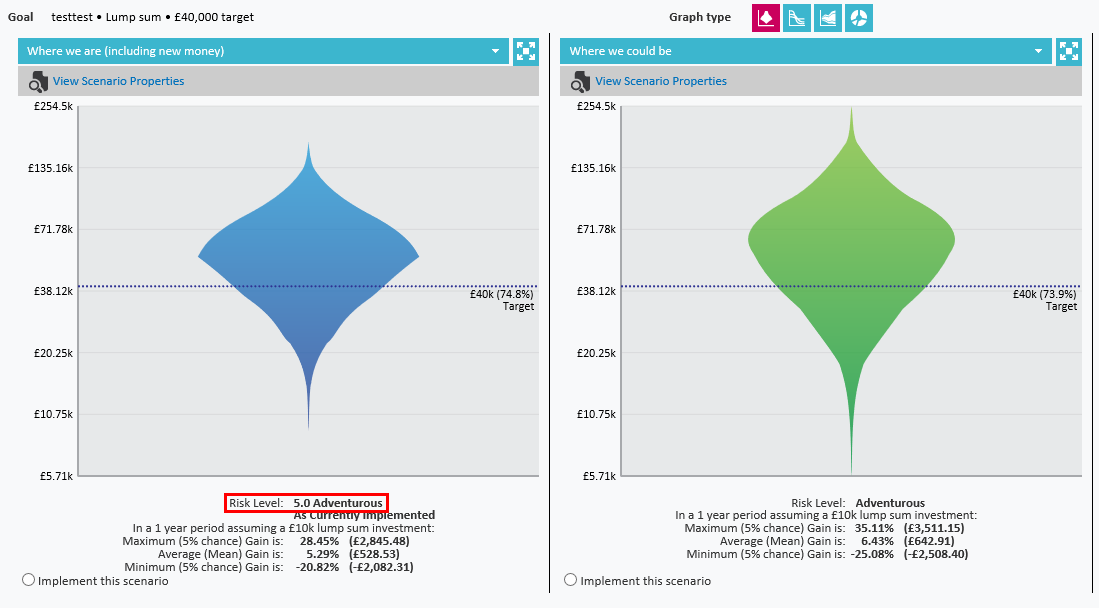
Once you have completed the 10k screen, you are able to see the risk rating under the 'Where we are' graph within the probability graph area. This allows you to easily compare where your clients current holdings are against 'Where we could be' in the second graph:
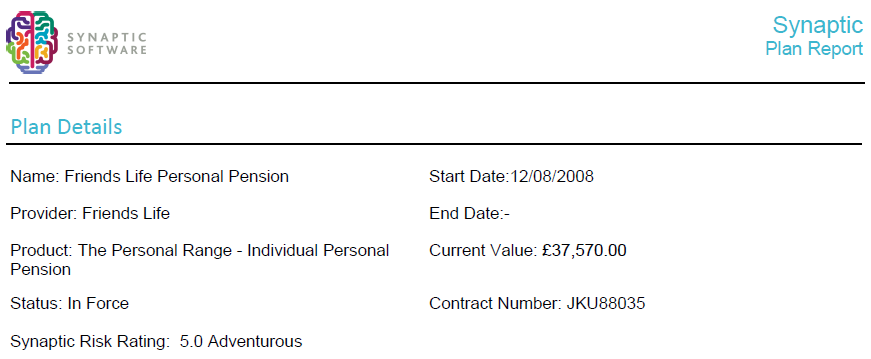
Once the Modeller scenario is completed, you are able to see the risk rating within the report: