The asset allocation graph shows a pie chart of a fund’s industry/sector holdings. It can be used either to illustrate the holdings of a single fund or to compare the holdings of multiple funds.
In the example screenshot below a typical UK growth fund is being compared to an index tracker. The holdings are very similar – the actively-managed fund is adopting a relatively low-risk position by largely mimicking the constituents of the index which it will be compared against.
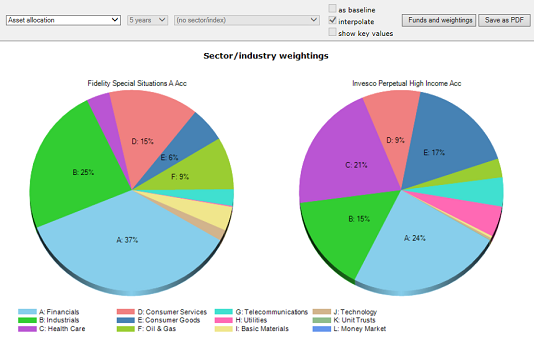
However, the manager has gone significantly overweight in cyclical services compared to the index, and underweight in non-cyclical consumer goods.

