Quartile ranking
A fund’s quartile ranking is its position within its IMA/ABIsector, based on absolute past performance, over a given time period. Synaptic Research uses two different measures of quartile rankings within its fund factsheets:
- Cumulative, to date. For example, the cumulative quartile ranking over 5 years uses the fund’s performance over the last 60 months.
- “Annual”, i.e. within an individual 12-month period. The annual quartile ranking for “5 years ago” is based on the fund’s performance during the period 49-60 months ago.
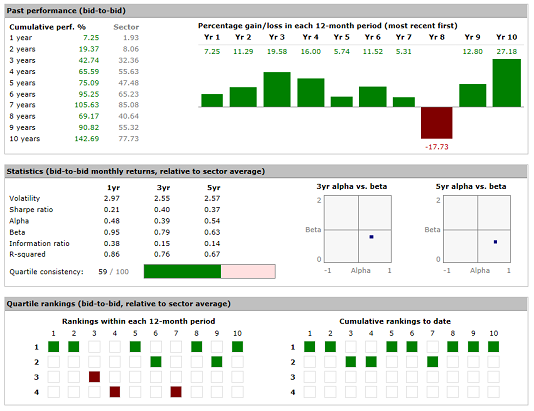
N.B. It is common for funds to have (relatively) consistent cumulative rankings which mask much greater variation year-on-year. In the example illustrated by the screenshot to the right the fund’s exceptional performance in years 1, 4, 5, 7 and 8 is concealing much poorer performance in other years. Investors who have held the fund for a full ten years will be very happy. Anyone who held the fund for only some of the time is likely to have had a much more disappointing experience, despite the fact that the fund is top quartile over all cumulative time periods up to 10 years.
Volatility
Volatility is calculated as the standard deviation of the fund’s returns over the last 36 months.
R-squared
R-squared is the square of the correlation between the returns of the fund and the returns of its IMA/ABI sector average on a monthly basis. Synaptic Research shows r-squared measured using the monthly returns over 36 and 60 months in its fund factsheets.
R-squared is on the scale 0 to 1. Values significantly below 1 (e.g. 0.75 or lower) indicate that there is little correlation between the fund and its sector average, and that risk metrics based on the sector average (such as alpha and beta) are of limited meaning or reliability.
Beta
Beta is an expression of the variation in a fund’s returns compared to its IMA/ABI sector average. For example, beta of 1.2 means that, for every n units by which the sector average rises, the fund tends to rise by 20% more – but also falls by 20% more when the sector average falls. Therefore, beta is widely used by financial advisers as a measure of a fund’s level of risk compared to its sector average (as opposed to volatility, which is used as a measure of absolute rather than relative risk).
Synaptic Research calculates beta based on monthly returns, and displays measures for 36 and 60 months in its fund factsheets.
Beta generally lies in the range 0.5 to 1.5 (but can, in theory, have any value). As described above, beta is of limited meaning if there is little correlation between a fund’s returns and its sector average (as indicated by the fund’s r-squared).
Alpha
Alpha is a measure of a fund’s returns compared to its IMA/ABI sector average, after adjusting them for any greater/lesser risk in the fund as measured by beta.
Alpha is widely used by financial advisers to identify fund managers who are “adding value” – i.e. delivering exceptional returns even after adjusting for any extra level of risk the fund manager is taking on. Alpha of greater than zero indicates that the fund is out-performing the sector average after adjusting for risk. Alpha of less than zero indicates that it is under-performing.
If a fund has beta of 0.8 – i.e. it tends to move by 20% less than the sector average, and so is 20% “less risky” – then it will have positive alpha if its returns are at least 80% of those of the sector average. Similarly, if a fund has beta of 1.0, then its alpha will be positive simply if it has beaten the sector average.
Alpha indicates the number of percentage points by which the fund has beaten the sector average per month. A figure of 0.5 therefore indicates that the fund has out-performed the sector average by about 6.5% over 1 year, and about 20% over three years.
Alpha generally lies in the range -1.0 to +1.0 (but can, in theory, have any value). As described above, alpha is of limited meaning if there is little correlation between a fund’s returns and its sector average (as indicated by the fund’s r-squared).
Synaptic Research displays measures of alpha for 36 and 60 months in its fund factsheets.
N.B. Unlike some systems, Synaptic Research does not produce “risk-adjusted” measures of alpha where a risk-less return (e.g. the return on cash) is subtracted from the fund’s returns. Synaptic regards such adjustments as misleading.
Sharpe ratio
A fund’s Sharpe ratio is a measure of its absolute risk-adjusted performance: its performance relative to a cash investment. Synaptic Research calculates Sharpe ratios using the monthly returns of the fund versus the monthly returns of the average money market unit trust.
Sharpe ratios are good if high, and are greater than zero if the fund has beaten a cash investment. They are negative if the fund has underperformed cash. The idea is that the higher the Sharpe ratio is, the better the return the investor is getting in exchange for the extra risk of investing in something other than cash.
Sharpe ratios are inversely related to volatility (because cash has low volatility). A fund’s Sharpe ratio will tend to be high if its volatility is low.
Sortino ratio
A fund’s Sortino ratio is similar to its Sharpe ratio but only looks at the volatility of the fund’s negative returns (relative to cash). In other words, it distinguishes between “good” volatility and “bad” volatility, and only penalises funds for the latter.
In the view of some analysts, the Sortino ratio is more useful than the Sharpe ratio if the returns of the security being analysed are not normally distributed – which is quite definitely the case with almost all mutual funds.
Information ratio
A fund’s Information ratio is like its Sharpe ratio, except that the fund’s returns are compared to its sector average rather than cash. Therefore, it is an expression of the risk-adjusted extra return which an investor is getting compared to the average fund in the sector. The Information ratio is greater than zero if the fund has beaten the sector average.
In practice, the Information ratio assumes that investors want to minimise peer-relative risk – they prefer funds which mirror the sector average, and which rise when the sector rises and fall when the sector falls. A fund which beats the sector average while having the same pattern of ups and downs will have a high Information ratio. A fund with the same overall performance but lower correlation against the sector average will have a lower Information ratio.
Sector and cash covariance
Synaptic Research calculates the covariance of mutual funds against their sector average and against cash. For ranking purposes, both of these figures are treated as good if low. This is in order to allow use of the covariance figures to prefer funds which are intended to non-core or “satellite” parts of the portfolio, and where it is therefore desirable if their returns are less synchronised with those of the portfolio as a whole
Kurtosis
Synaptic Research calculates the kurtosis of a fund’s monthly returns in order to identify funds which are relatively short-tailed (positive kurtosis) and long-tailed (negative kurtosis). For ranking purposes, Synaptic Research treats kurtosis as good if high, in order to prefer funds with a relatively low chance of returns significantly far from the fund’s average.
Quartile consistency
Quartile consistency is a proprietary Synaptic calculation of the consistency of a fund’s quartile rankings – its rankings within its IMA/ABI sector for each twelve-month period over the last 120 months.
It is measured on a scale of 1 (worst) to 100 (best). A score of 100 is reserved for funds which have been top-quartile within their sector in every single one of the last ten 12-month periods.
The scores are weighted logarithmically based on the length of the fund’s history – a fund cannot achieve a score of 100 without a full 120 months of past performance data. For example, a fund with 7 years of past performance has a maximum possible score of 92, and a fund with 4 years of past performance has a maximum possible score of 78.
The most recent 5 years are given approximately a 20% greater weighting than the preceding 5 years.
NOTE: If at any time in the fund’s history, the sector contained fewer than 4 funds, the quartile consistency calculation will ignore any previous periods.
FE Crown ratings
The FE crown ratings are a quant-based ratings system designed to highlight funds that have had superior consistent performance in relation to risk, relative to their peer groups. Peer groups are deemed to be the sectors as defined by the IMA and ABI or using the FE Global sector set. Within each sector, The top 10% of funds will be awarded five FE Crowns, the next 15% receiving four Crowns and each of the remaining three quartiles will be given three, two and one Crown respectively. No crowns means the fund has not been rated.
Funds are not rated for the following reasons:-
a) the fund is less than 3 years old
b) the sector is not meaningful for comparison purposes - e.g. the Specialist or Personal Pensions sectors
c) the sector has had too few members over 3 years to be significant
The rating is made up of three constituents:-
a) Alpha relative to the sector, measured over 3 years but with a higher weighting given to the more recent rather than the more distant past.
b) Volatility, measured over 3 years but with a higher weighting given to the more recent rather than the more distant past.
c) Consistency, based on a fund's performance ranking within its sector in each quarter of the last 3 years. Each quarter is weighted equally.

