All research must be performed against a contact, click on Contacts in the left hand menu.
In the Contacts screen, you should by default see a list of available contacts to choose from, click on the name of the person you wish to conduct research against:
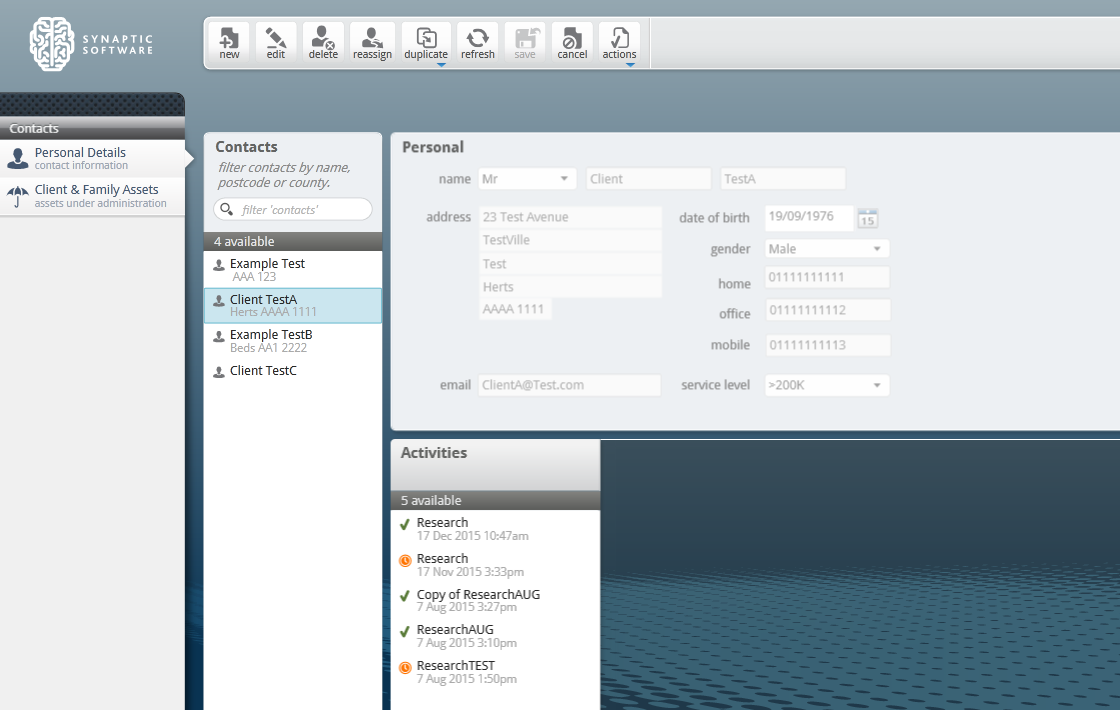
If you have no contacts, or wish to create a new one, please see the related link at the bottom of this article.
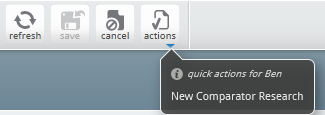
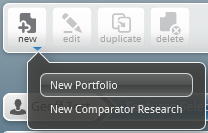
Click actions > New Comparator Research
If you already have some research open, you will see the following message:
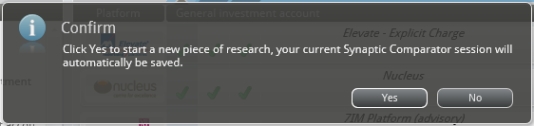
Clicking Yes will take you to a blank piece of research (clicking No will cancel the request to start new research), if you weren't in the middle of research you will go straight through to the New Research name pop-up:
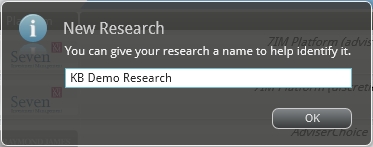
This allows you to give the research you are doing a name so should you need to refer to it later, it will be easier to indentify it in the contact record. Type in a name for your research, then click OK to continue on to the blank research screen (feature selection):
Start by completing the details in the middle panes, Platform Features & Availability:
Using the Platform Features pane, select what features you require from your platform, these are broken down into three types of features.
1. Headers,

These features cannot be selected in their own right, they need to be expanded by clicking on the arrow icon.
2. Parent / Child features
These have a top level feature like 'ISA Stocks & Shares' but you can also expand using the arrow icon and break down the requirement to the specific feature set of a stocks and shares ISA.
3. Feature
These are stand-alone features are chosen simply by ticking the box, they have no further options to drill down into.
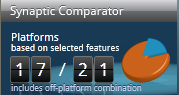
When selecting features, any platforms that cannot support the feature will be removed from the running. The count of available platforms will show the amount of platforms that can meet the feature set (left) next to the amount of platforms available in total (right).
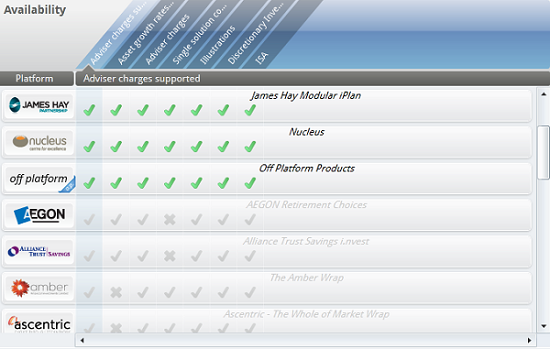
You will also see next to the platform names, ticks and crosses appearing depending on if they can support your feature set. If the platform cannot support all of your required features, they will be removed from the running and the whole line will go grey.Green tick means that this platform supports the requested feature (the feature is shown above the tick).
Grey cross means this feature is not supported on the platform (the feature is shown above the cross).
Grey tick means that although this particular feature is supported, due to one or more other features not being supported the platform is still eliminated (the feature is shown above the tick).Other platforms might also show with a full row of green ticks, but have the logos greyed out. This means that although the platform can support the features you require, they have not currently verifed the charge data, so they cannot currently be used in the research:
Once you have finished with the Platform Features, you must now enter details about the Investment in the right pane:
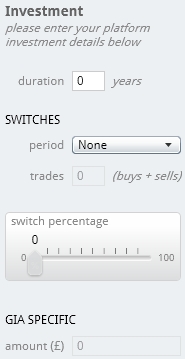
Duration is the term you wish to conduct the investment over. This is also used when calculating the results.
SWITCHES can be related to your client servicing proposition, how often you will be reviewing the investment, how many trades and the percentage that will be switched
Period gives the option of None, Monthly, Bimonthly, Quarterly, Half-yearly or Annually
Trades is a free type number field to enter the amount of buys + sells.
Percentage will allow the selection from 0% - 100%
GIA SPECIFIC is the amount that will be invested directly into unit trusts, investment trusts, etc..
After entering the investment details, you are now ready to move on. The simplest way of progressing through the system is to use the two arrows located above the Investment pane:Clicking on the right facing arrow will take you forward to the next section of the research you must complete, the left facing arrow will take you to the previous step. You can only click on arrows when they are not 'greyed' out (in the above image we can only move forward as we are still on the first step).
In this example, the selected features are:
ISA Stocks & Shares
Self Invested Personal Pension
Onshore Bonds
Personal Pension
The lefthand menu now has these options enabled:
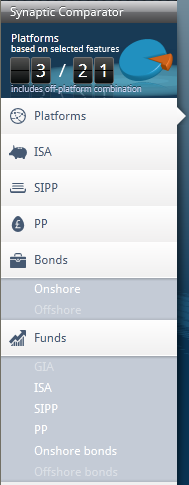
Clicking the right arrow takes you to the first section to complete, in this example ISA. You can also click directly onto the ISA or any of the other feature buttons.
You can now filter the features even further, using the same system used to select the Platform Features. Once you've finished adding your required features, you are required to fill in the Investment pane on the right hand side for each feature (ISA, SIPP, PP & Bonds (Onshore & Offshore)).
For further information on what is required for each Investment pane, please see the linked related articles.
Use the right arrow to move on to the next feature and repeat the process. As with the Platform Features selection, if you select a feature that one platform cannot support, they are removed from the running:Once you've finished with the platform features, you will be taken to the Funds section where you need to select a portfolio for each feature you have chosen (they show up highlighted in white). The right arrow will take you through these from top to bottom, alternatively you can click on them individually:

You can now double click on an existing portfolio from the Portfolios pane, or click new > New Portfolio if you would like to create a new portfolio:
For more information on how to create portfolios, please use the Knowledge Base article 'Creating a Portfolio'.
Once you have selected portfolios for all of your features, you can either click the right arrow, or click on the Results button in the navigation bar:
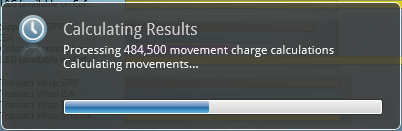
You will then see a calculating results message, detailing how many results it's working through and showing a progress bar
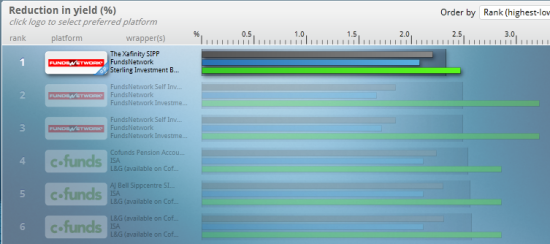
Once complete, you will be presented with the results screen, by default listing the results by the lowest RIY:
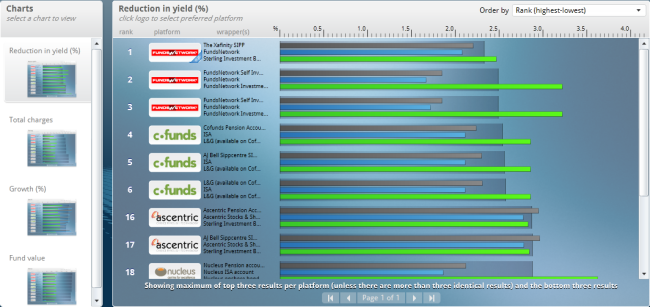
In the Charts pane you can see the different results charts available (Reduction in yield, Total charges, Growth (%) and Fund value).
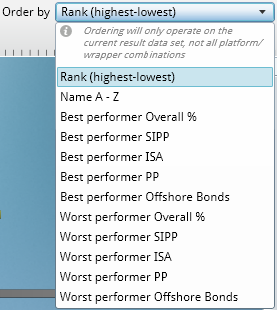
In the right hand coloumn where the results are displayed, you get the option to change how the results are displayed:
To get more information on any of the platforms that have returned results, click on the graph shown next to the platform, you will then get a breakdown of the platform:

Click on details for further information, including the breakdown of the charges:
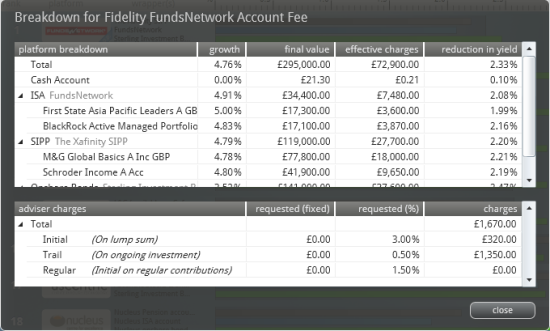
Click close to exit the breakdown and return to the results screen.
Once you have decided which platform to use, click on the name/logo of the platform which will then grey all of the other platforms out:
Now click on View Report in the navigation bar:
You may be prompted to select which factsheets (if any) you would like in your report. This depends on whether you have selected them within the Setup area. If the factsheets have been selected within Setup, you won't get the selection here. There will be an section for you to confirm why a particular platform has been chosen.
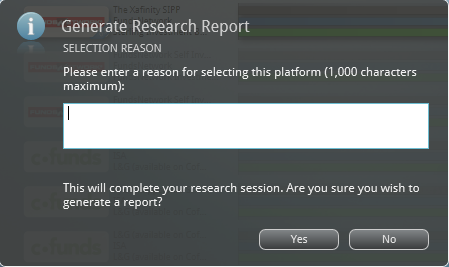
You may decide not to include a reason. Click Yes to generate the report or No to return back to the results screen.
If you have clicked Yes, your report will open in a new browser window. If you do not have 'pop-ups' enabled you may get a warning, this is OK to accept and will be needed for your report to load. Once the report has been selected, the piece of research will have been 'fixed' and amendments cannot be made.
You have now finished your research. The report you have just generated will be available under the Contacts section, under the contact you have generated the research on, under the name you gave this research.

