The portfolio value graph can be used for a projection of two things: either the performance of a hypothetical portfolio starting n years ago, or the historical performance of a current portfolio given its current holdings.
You specify the amount invested in each fund using the Funds and weightings button on the graph window’s toolbar. This displays the form illustrated by the first screenshot below. The value of each fund can be entered either as a cash amount, or as percentages. In the example screenshot £1,000 has been invested in each fund.
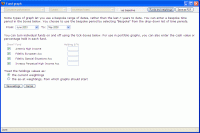
The Funds and Weightings form also lets you specify whether the holdings should be treated as the current values, or whether you want to project the performance of a portfolio starting with these weightings a number of years ago. In the example screenshot the latter has been selected: the weightings will be used as the starting point for the graph.
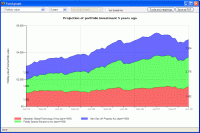
The second screenshot then shows the results of these settings. Each fund starts at £1,000 and then rises and falls over the chosen period of 5 years. The total of the three blocks for each fund represents the overall performance of the portfolio: a rise from the initial £3,000 to £4,962.
It may be useful to note that this graph can also be used with a single fund, in order to show the performance of a bespoke lump-sum amount. In other words, when viewing a single fund, it is like the cumulative performance graph, but with the added ability to change the amount invested.

