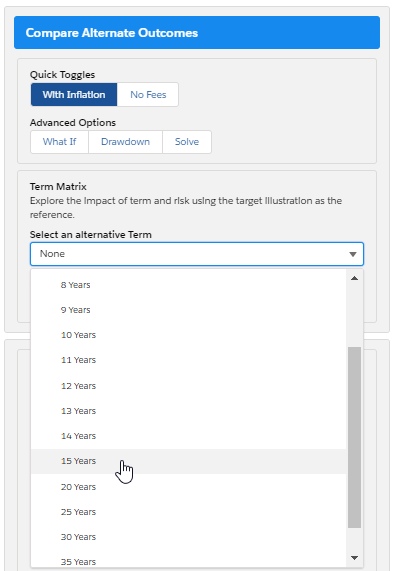
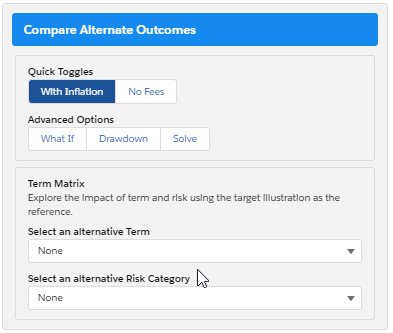
Term Matrix is found within the Compare Alternative Outcomes area of an Illustration.
You are able to explore the impact of term and risk using the illustration as reference. Select one or more options here and it will add details of the scenario to the Term Matrix area and graph.
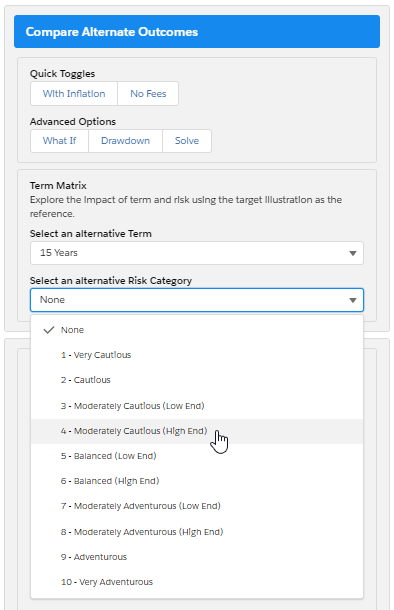
In this example, the original illustration has a 10 year term and the client's risk rating is Balanced (Low End).
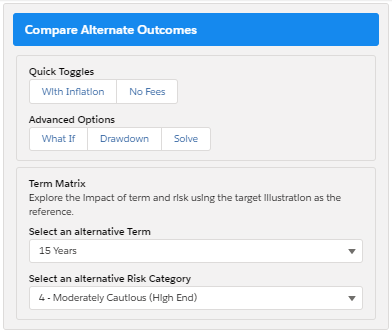
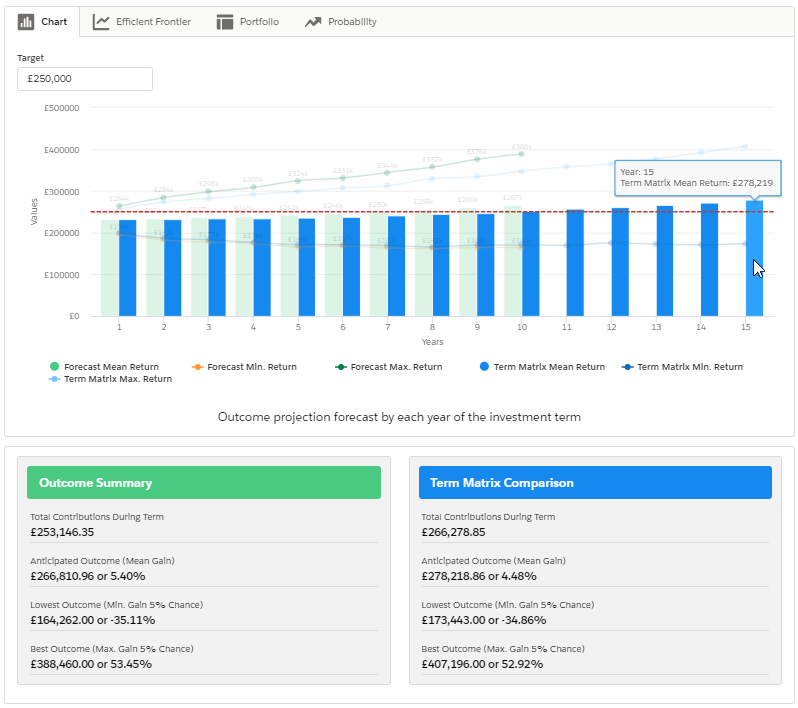
We will use the Term Matrix to lower the risk, but up the term to 15 years. This has updated the details of the Total Contributions During Term, Anticipated Outcome (Mean Gain), Lowest Outcome (Min. Gain 5% Gain) and Best Outcome (Max Gain 5% Chance) as seen below: