This article is a continuation of - Illustrations - Edit Outcome - Alternative Outcomes
The 'What If' scenario allows you see how an alternative scenario compares against the illustration you've created.
Select the 'What If' button within the 'Compare Alternative Outcomes' area on the right side of the screen.
This will open the 'What If' section below:
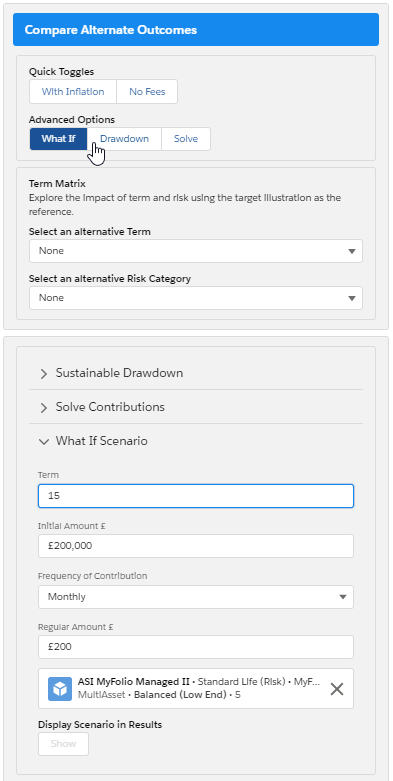
You are able to see how a change in the Term, Initial Amount, Frequency of Contribution, Regular Amount and Portfolio will affect the results without changing the original inputs.
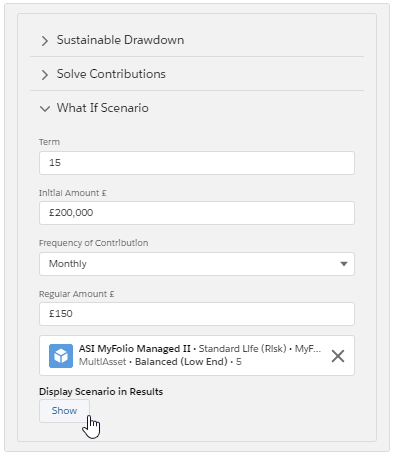
In this example, the original illustration has a 10 year term, £100,000 initial investment with a £200 regular amount. As seen in the below screenshot, we are going to show how a 15 year term and a £150 regular amount compares against the Illustration.
Click 'Show' to show the inputs into the graphs and the alternative outcome summary.
This will add the 'What If' Min, Mean and Max scenario to the graph, allowing you to compare the scenario against your illustration: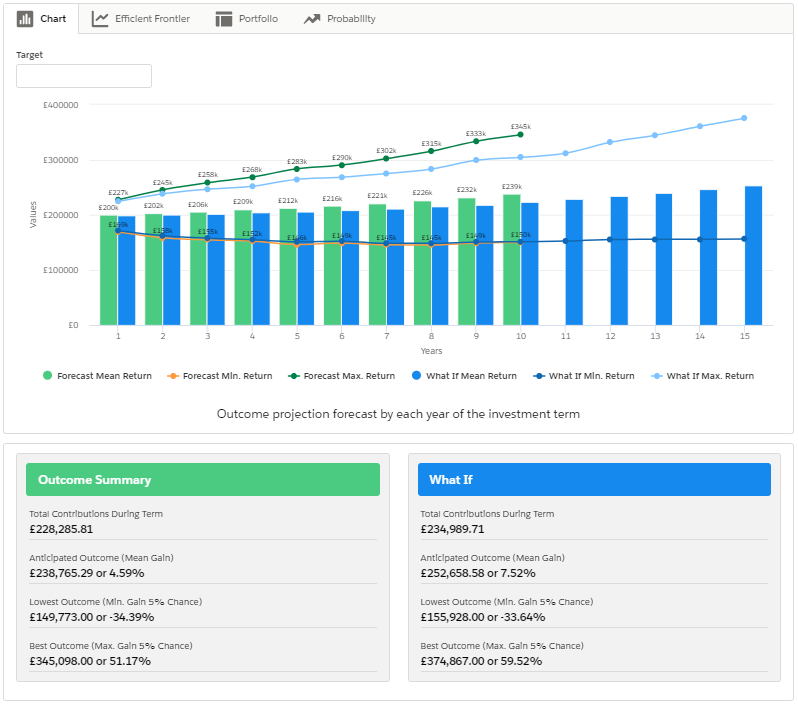
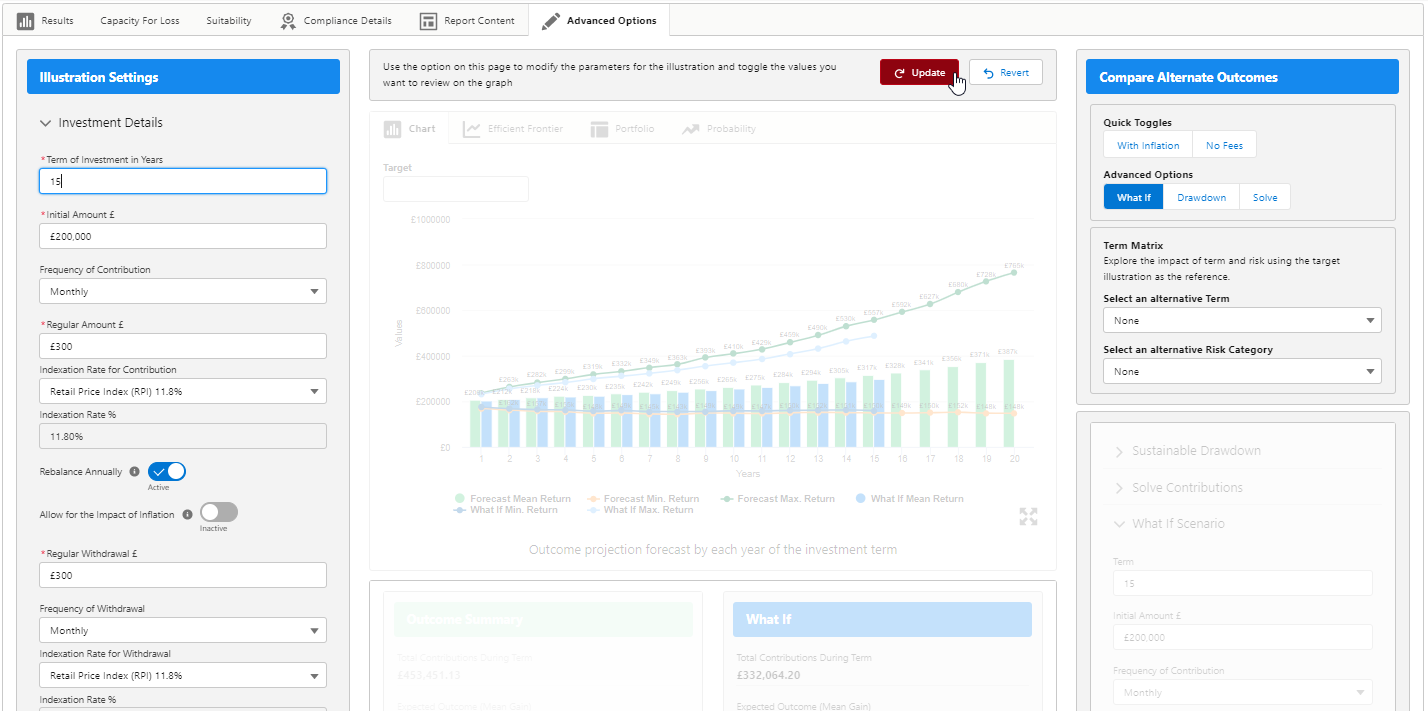
The 'What If' scenario will not change the details of your original illustration, but you are able to change the inputs until you are happy with the results. If you wish to update your original illustration, update the Illustration Settings on the top left of the screen.
See next article - Illustrations - Edit Outcome - Sustainable Drawdown

