This article is a continuation of article Risk Illustrations - Advanced Options - Illustration Settings
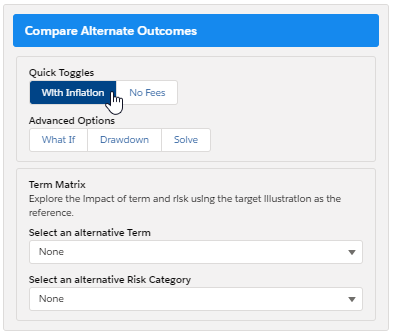
Alternative Outcome is found within the Advanced Options tab of the Results screen.
There are multiple alternative outcomes you can compare:
- Inflation
- No Fees
- 'What If' Scenario
- Sustainable Drawdown
- Solve Contributions
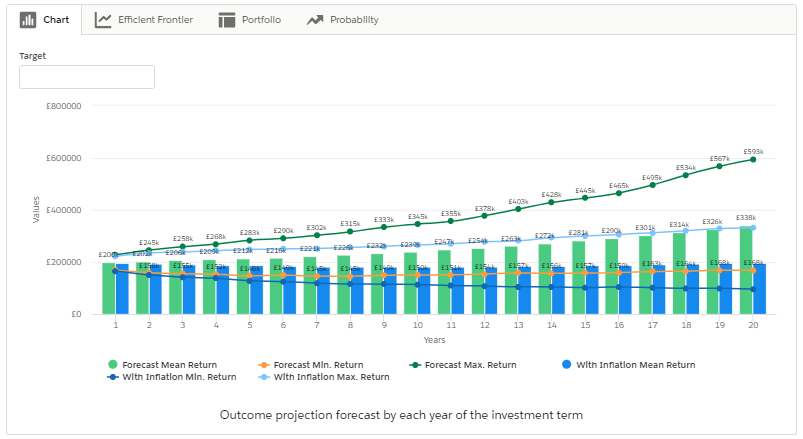
Selecting one of the options will populate the charts and the Alternative Outcome area.
In this example, we have selected Inflation. You will see Total Contributions During Term, Anticipated Outcome (Mean Gain), Lowest Outcome (Min. Gain 5% Chance) and the Best Outcome (Max. Gain 5% Chance) which include the impact of inflation.


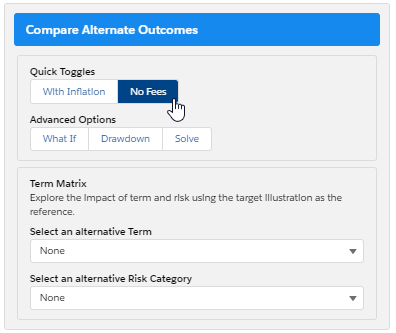
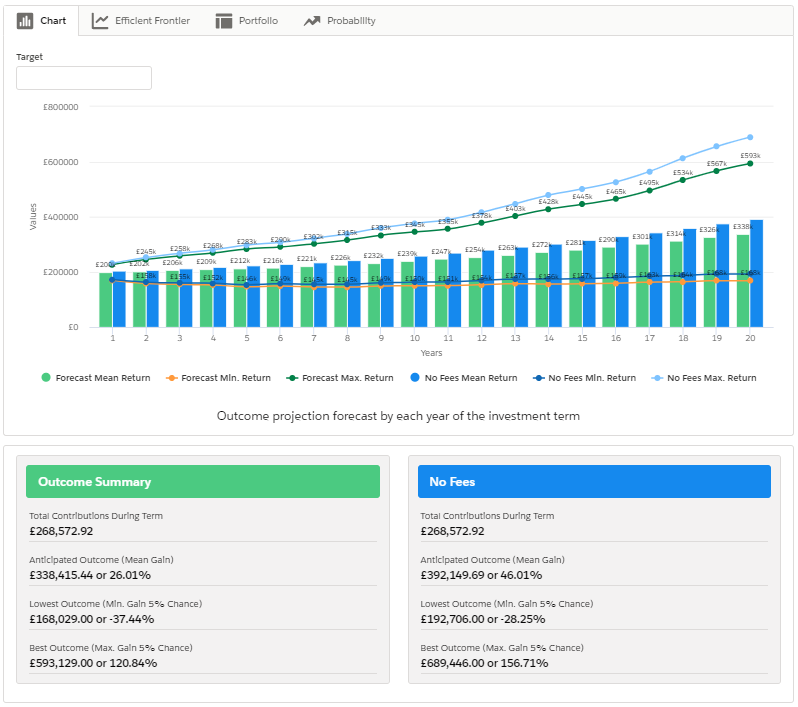
If you select 'No Fees', this will update the figures to excludes fees:


If you select 'What If', this will open up the section at the bottom right. This is covered in more detail within the article - Risk Illustrations - Advanced Options - 'What If' Scenario

When selecting 'Drawdown', this will open the Sustainable Drawdown area on the bottom right of the screen. This is covered in more detail within the article - Sustainable Drawdown.

The 'Solve Contribution' button will open the 'Solve Contributions' area on the bottom right. This is covered in more detail within the article - Solve Contributions

Alternative Outcomes will also be shown in the following tabs above the graph, see article Risk Illustrations - Advanced Options - 'What If' Scenario
