The results page is where you can see the input details and whether the desired income profile can be achieved. This page displays the complete journey for this scenario, as such includes both the phased period results and the remaining period results.
The details used in the calculations are displayed in the Summary on the left hand side of the screen. Unlike the main Analyser journey, for phased drawdown the inputs on the results page cannot be changed.
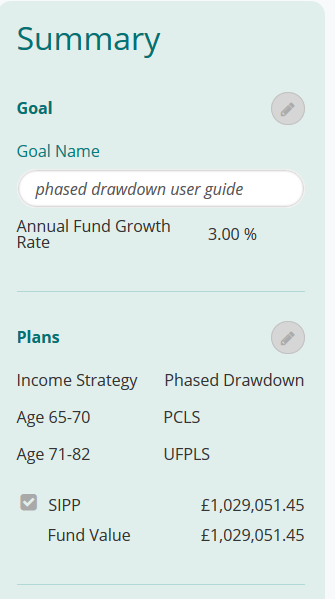
The graph at the top of the page shows if the income requirement has been met for each year of the goal. Each bar is comprised of the income components that make up the income for that year.
Hovering over the bar for a particular year will display the values for that year.
The income requirements are input into the system as a net figure, the system then determines how much will need to be withdrawn from the drawdown fund to satisfy the net income requirement, factoring in other income and tax that would be paid.
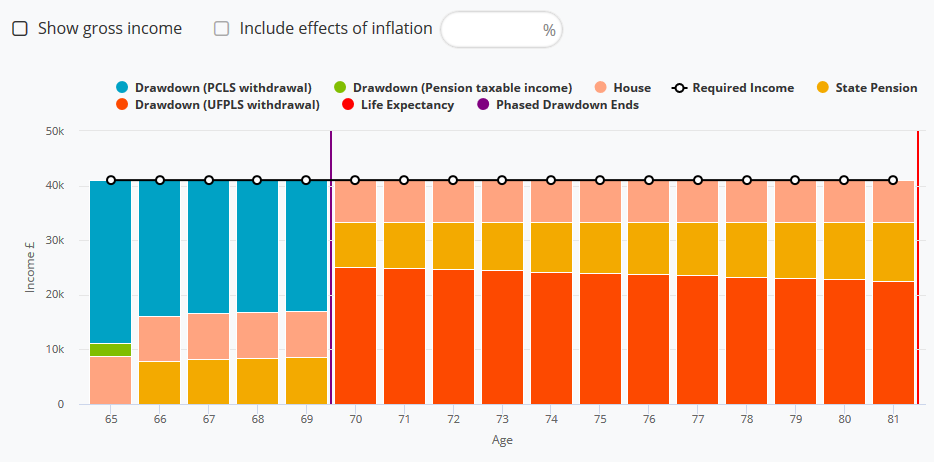
The graph can be toggled so that it shows the gross figures rather than the net position, also an inflation figure can be input to show what the effects of inflation will have on the income over the course of the term.
Beneath the income graph there are information boxes, one is the annuity value (either the Webline Annuity Service value or the overridden value), next to this is:
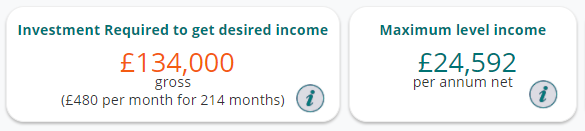
Investment required to get desired income – this box displays values when the income profile has not been achieved for the duration. The figure displayed shows the extra investment required to reach the desired income level.
Maximum level income – this shows you how much income is achievable on a level basis. If the income requirement is set to this figure, the drawdown plan will aim to reach a final value of zero by the time the scenario ends.
The second graph displayed is the Fund Value graph.
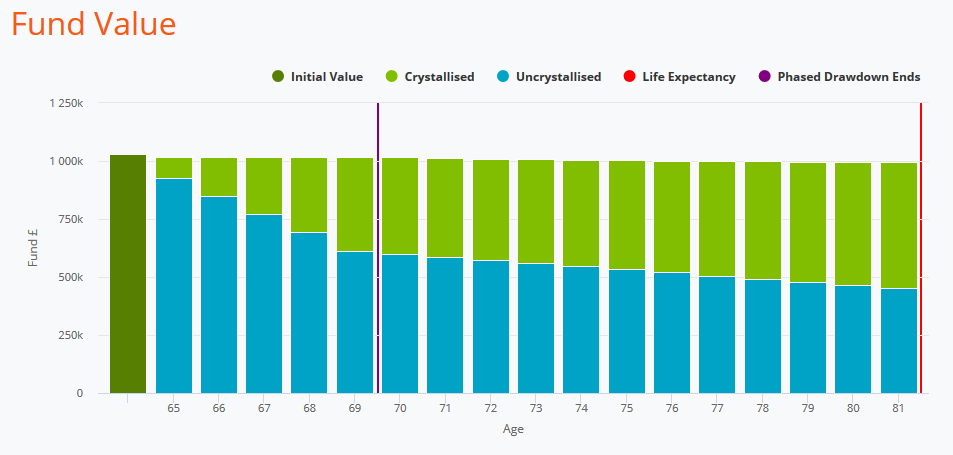
The fund value graph displays how much remains in the fund each year until the end of the goal. Hovering over any of the bars will display the fund value at the end of that year. The fund values are split into Uncrystallised funds and Crystallised funds.
An income analysis report can be produced by pressing the report button at the top of the page. If all you need is the graphical output, you can get these by selecting export charts. When any report is produced this is saved back to the client’s goal.
Once you have achieved the desired income profile and analysis, you can either end your session, or move onto the product comparison.
Moving to the product comparison screen from income analysis will take the details on screen (this will use the final values if they have been changed from what was originally input) and use that information in the product comparison.

