| The filtering screen provides access to a wide variety of functionality. The key parts of the screen are illustrated by the numbers in the screenshot below, and are described below. |
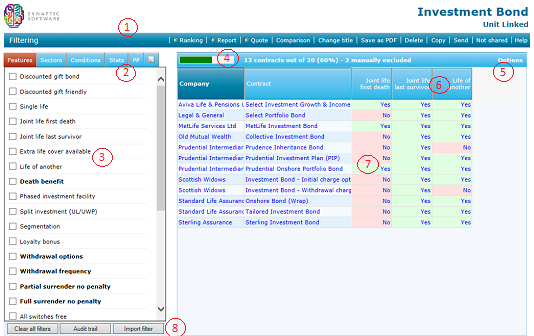
1. The menu bar
| Like all other pages in the software, the filtering screen has a menu bar of frequently-used links: ·Ranking. Moves to the ranking stage, for turning the contracts into a league table in order of preference. ·Report. Moves to the report stage. ·Quote. Links to your quote engine. ·Comparison. Generates a comparison report showing all the features of the contracts remaining in the grid. ·Change title. Gives the piece of research a new title, making it easier to remember/find. ·Save as PDF. Saves the research grid as a PDF document. ·Export. Saves the research grid in CSV form for opening in Microsoft Excel or similar software. ·Delete. Deletes the research. ·Copy. Creates a new piece of research based on the current research. ·Send. Sends the research to another user of the system. ·Shared/Not shared. Switches the research between shared and unshared mode. |
2. Tabbed groups of fields
| All the fields of information which Synaptic collects about the product type are displayed in tabbed groups to the left of the filtering grid. The number of field-groups which is available depends on the type of product, as described in the section about Synaptic’s data. In addition, there is also always an extra tab for recording notes about your research. N.B. This left-hand portion of the screen can be hidden, so that the grid of data has more space available to it, using the Hide field list link on the pop-up Options menu – see below. |
3. The fields within each tabbed group
| Each field within the currently selected tabbed group is displayed in the main box to the left-hand side of the screen. You can filter on a field using the tick box (or numeric filtering boxes) next to its name. Fields on which you are currently filtering are highlighted. You can also add fields to the grid by clicking on their names.N.B. Right-clicking over a field name displays a pop-up menu of options, including (where available) a definition for the field. |
4. The header bar of the grid
| The header bar at the top of the grid shows three pieces of information: a horizontal bar indicating the percentage of total contracts remaining in the grid; a textual description of the number of contracts remaining; and a statement of the number of contracts which have been manually excluded. |
5. The Options link
| The Options link displays a pop-up menu of actions relating to the grid: ·Hide field list. Hides the field list, allowing the grid to take up the whole width of the screen. ·Field chooser. Displays a pop-up window for choosing which fields to include in the grid. ·Change field order. Displays a pop-up window for changing the order of fields already in the grid. ·Remove all fields. Removes all fields which have been added to the grid. ·Flip grid. Changes the orientation of the grid so that contracts are listed along the top rather than down the side. |
6. Column headers in the grid
| Like a spreadsheet, the grid includes a header for each column of data: the company and contract names which are always included, plus any fields which you choose to add to the grid. Clicking on a column header sorts the grid by that column. Clicking on it again re-sorts in reverse order. For columns other than the fixed Company and Contract columns, you can also click the right mouse button over the column header for a pop-up menu of options. |
7. Fields in the grid
| The main body of the research grid shows the name of each contract, plus any extra fields of data you have added to the grid. The company name in each row is a link to the company’s factsheet. The contract name is a link to the contract factsheet. In addition, you can click the right mouse button over the contract name for a menu of other options. Clicking on a data field in the grid – e.g. the value Yes for a particular feature – filters the list of contracts based on that value. |
8. Buttons
| There are three buttons at the bottom of the list of fields: ·Clear all filters. This removes all filtering from the grid of contracts (but does not clear any manual exclusions). ·Audit trail. This displays the matrix showing how/why contracts have been excluded from the research. ·Import filter. This allows you to copy the filtering and/or manual exclusions from an old piece of research into the one you are currently conducting. |

