The Comparison link on the menu bar of the filtering page shows every single field about the contracts remaining in the research grid. For example, it can be used to generate complete comparisons of a specific group of contracts (e.g. competitor analysis for product providers): you manually exclude all contracts other than the ones you are interested in, and then click on the Comparison tool.
N.B. The comparison tool only applies to product research. It is not available on fund research.
The Comparison tool vs. the Field Chooser
The Comparison tool is much faster than using the Field Chooser to add every single possible field to the main research grid. However, the extra speed does come at the cost of a couple of disadvantages:
- The comparison report is view-only, and cannot be filtered, sorted etc.
- The comparison report is only designed to display a relatively small number of contracts. The system will warn you if you try to include more than 10 contracts, and will simply not let you include more than 30.
The Comparison report screen
The screenshot below shows the result of clicking on the Comparison tool. The contracts are displayed in columns, and all the fields of data are displayed in grouped rows down the side. Long-text fields are shown separately at the bottom of the Comparison. 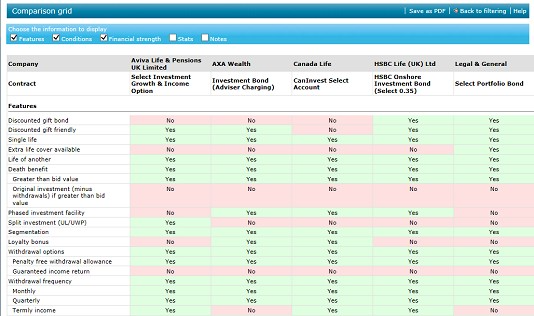 You can control which sections of the report are included using the bar at the top of the screen. You simply add or remove ticks against the sections you want. Once you have decided on the sections you want, you can then print the report (using your browser’s print option), save it in PDF form, or export it to Microsoft Excel (if your firm has purchased the optional Export functionality). |

