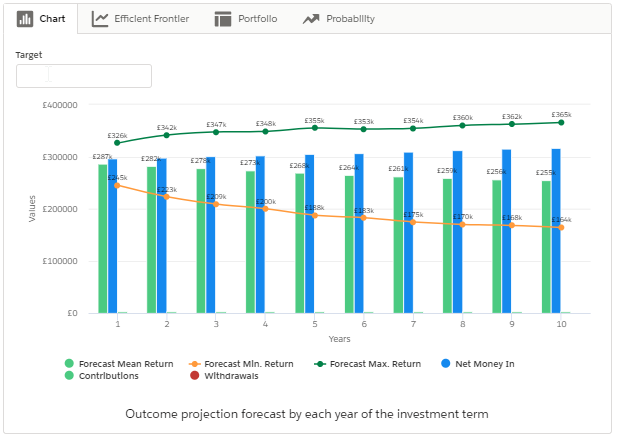
When within the Advanced Options screen of an Illustration, there is a Target Field at the top left of the graph.
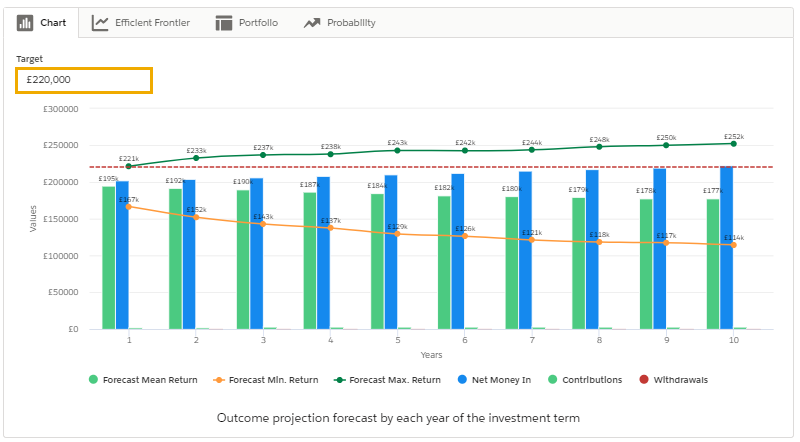
Entering a Target amount here will add a red target line within the graph, as seen below:
This field can also be populated when using the 'Solve Contribution' filter on the right side of the screen. If you are using other filters and would like to remove the red target line, delete the target amount from Target field within the graph:
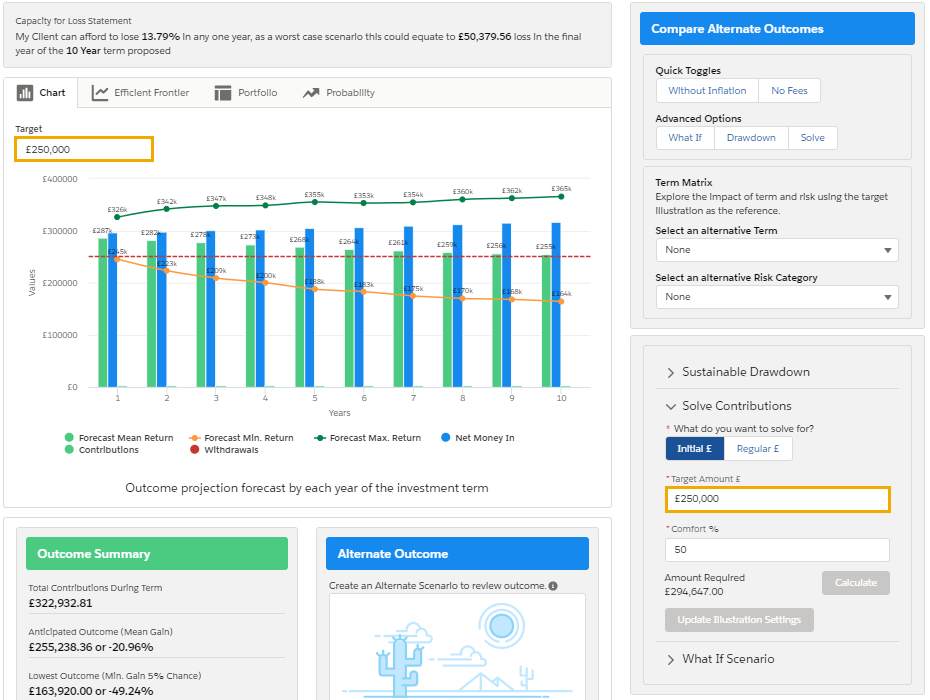
Please note - You will need to delete the figure and click away for it to update.