This article is a continuation of article Risk Illustrations - Advanced Options - Sustainable Drawdown
Solve Contributions is found within the Compare Alternative Outcomes area. Selecting the option will open 'Solve Contributions' on the bottom right of the screen.
This allows you to calculate how much your client will need to invest initially or on a regular basis to hit the Target Amount.
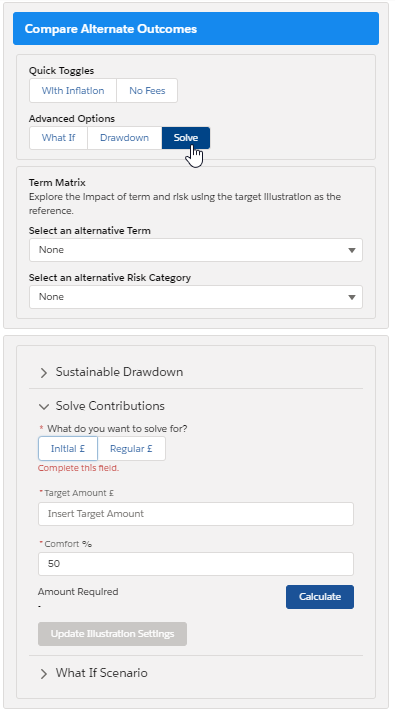
Select whether you would like to calculate what the initial or regular contribution would need to be to hit the target, then enter the target amount.
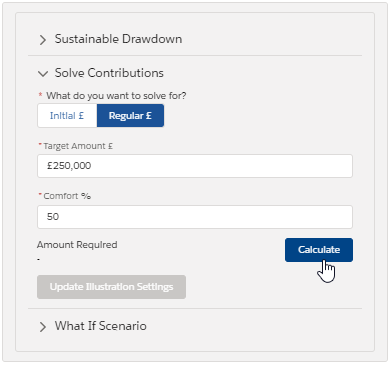
In the example below, we would like to calculate what the regular contribution would need to be to hit a target of £250,000 (the anticipated outcome - mean gain). The Comfort will default to 50%, as this will aim to hit the Mean gain figure. Then select 'Calculate'.
The client would need to contribute £128 a month to hit the £250,000 target based on the anticipated income (mean gain)
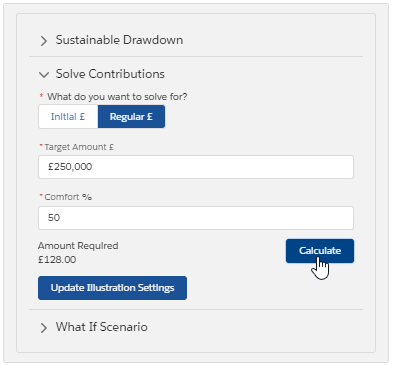
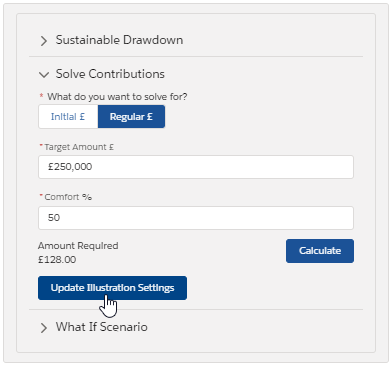
Click the 'Update Illustration Settings' to add the solve contribution line to the graph:
The graph shows the solver as a red line. It is set to hit the anticipated outcome (mean gain) target amount at the end of the 15 year term.
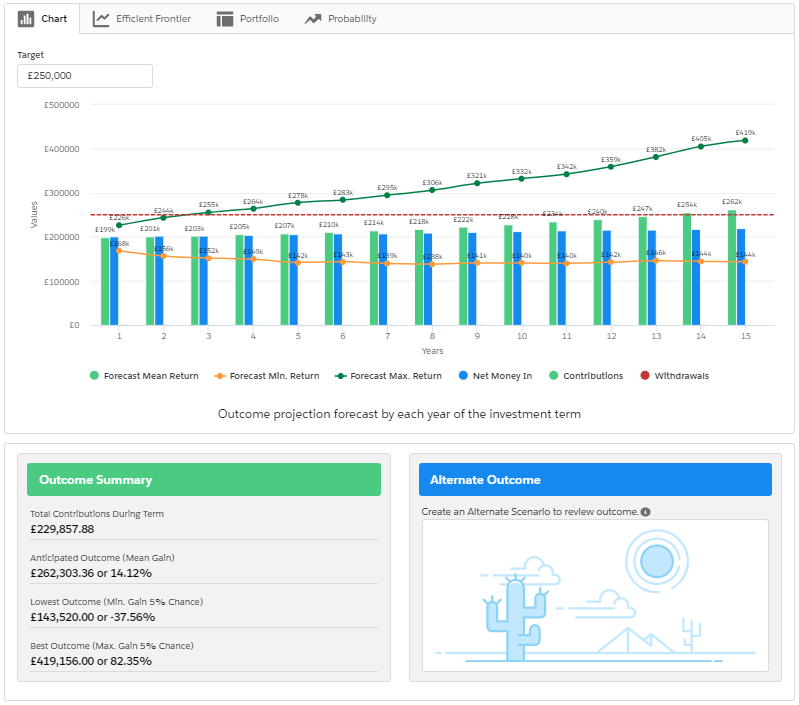
You can also use the Comfort % and Target Amount in the Solve Contributions area to hit the Lowest Outcome (Min. Gain) and Best Outcome (Max. Gain). Use the Outcome Summary figures below the graph for the Target Amount for Min, Mean and Max. A lower percentage works to the Min gain figure and a higher percentage works to the Max gain figure.
See next article Risk Illustrations - Advanced Options - Term Matrix

