
This article is a continuation of Income Analysis - Other Incomes
Once you have completed the Annuity area, Continue to Next Step: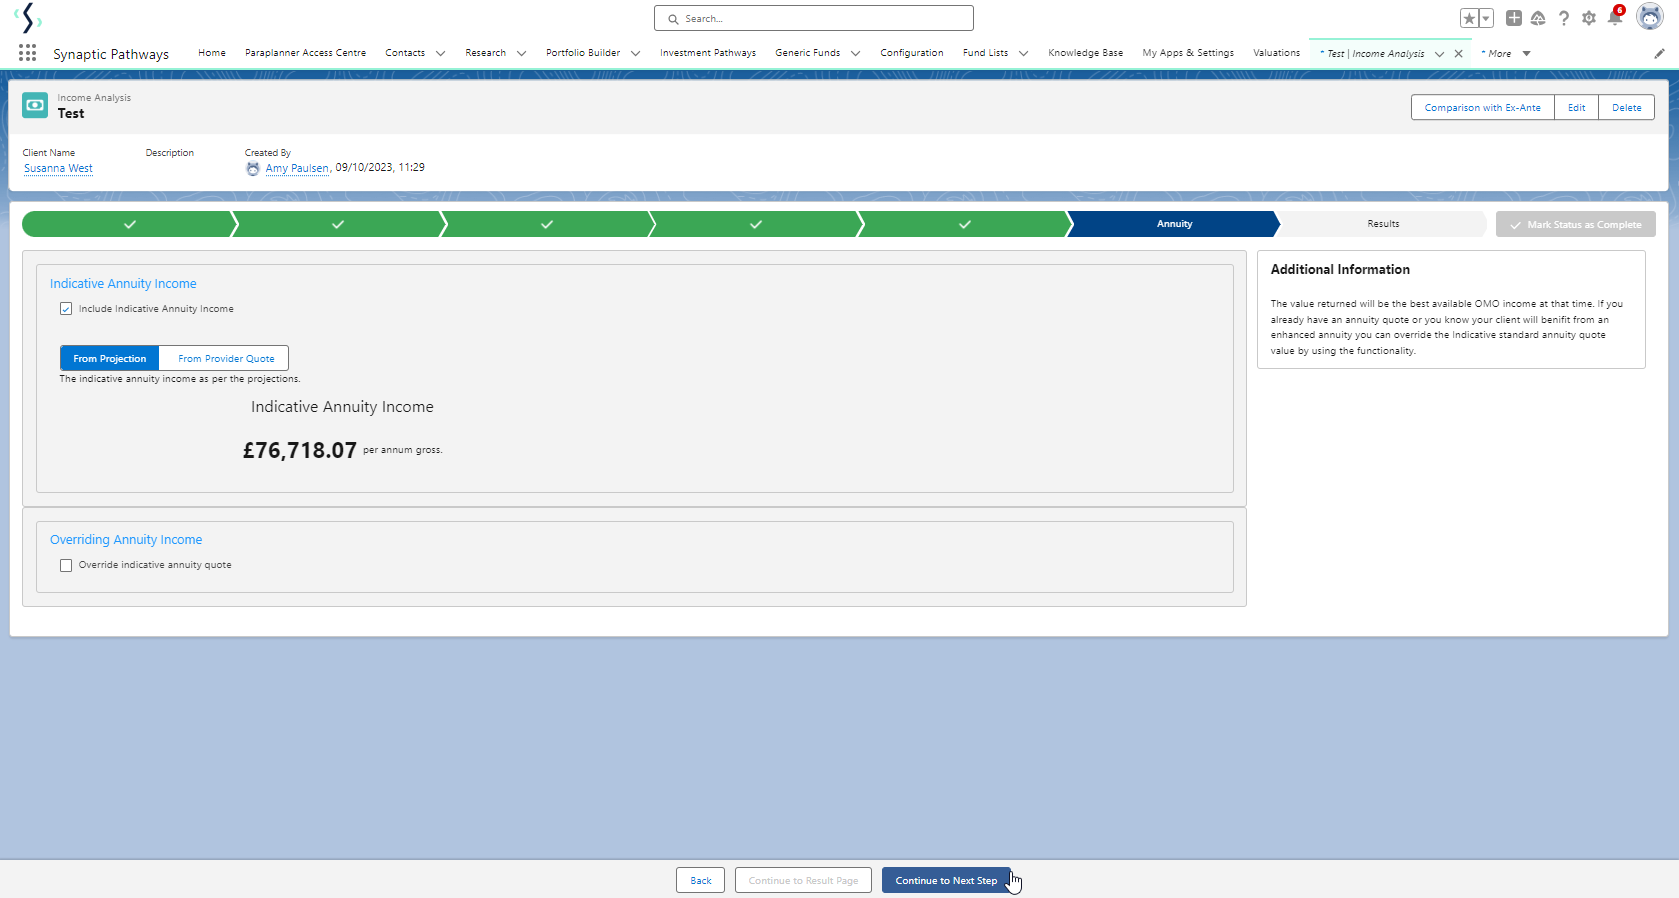
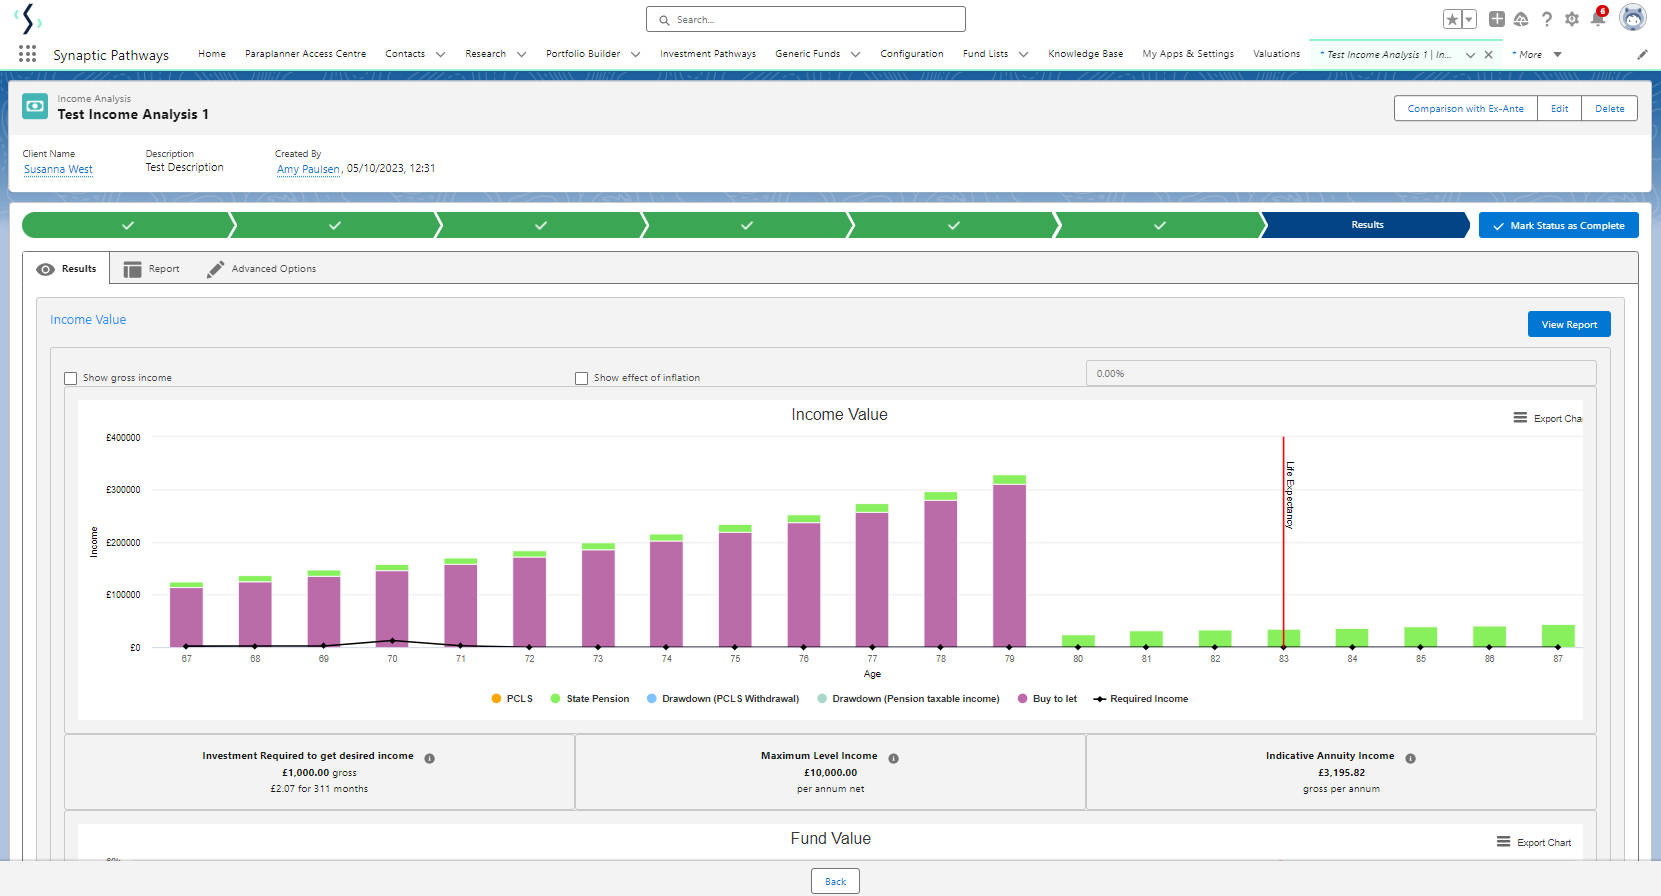
The Results screen will load, showing an Income Value Graph.
The graph at the top of the page shows if the income requirement has been met for each year of the goal. Each bar is comprised of the income components that make up the income for that year.
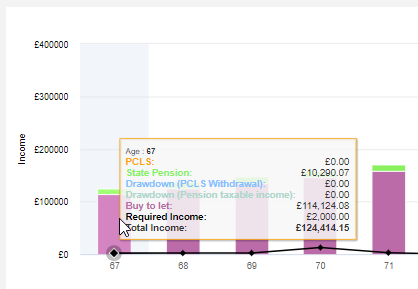
Hovering over the bar for a particular year will display the values for that year.
The income requirements are input into the system as a net figure, the system then determines how much will need to be withdrawn from the drawdown fund to satisfy the net income requirement, factoring in other income and tax that would be paid.
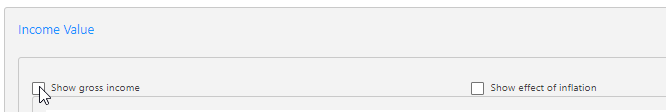
The graph can be toggled so that it shows the gross figures rather than the net position, also an inflation figure can be input to show what the effects inflation will have on the income over the course of the term.
Beneath the income graph there are information boxes.
Investment required to get desired income – this box displays values when the income profile has not been achieved for the duration. The figure displayed shows the extra investment required to reach the desired income level.
Maximum level income – this shows you how much income is achievable on a level basis. If the income requirement is set to this figure, the drawdown plan will aim to reach a final value of zero by the time the scenario ends.

The second graph displayed is the Fund Value graph.
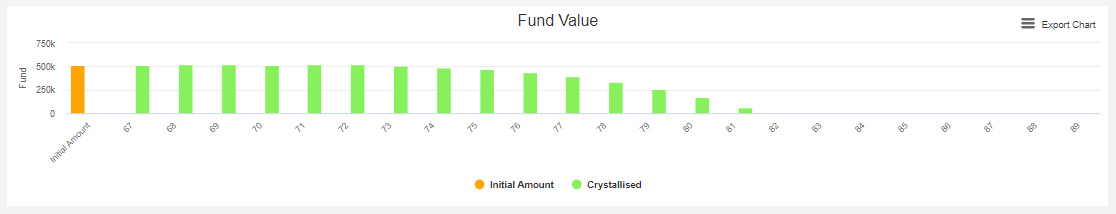
The fund value graph displays how much remains in the fund each year until the end of the goal. Hovering over any of the bars will display the fund value at the end of that year.
For further information on Income Analysis research, see article Income Analysis - Results - Export Charts
